Store data in database
This guide will show you how to get started with saving live data in a database (to be able to view it later).
This tutorial expects that you start from scratch with a brand new playground. See Getting Started to get up and running if you haven't already.
We will store the data in InfluxDB, which is a time-series database. This is a type of database that is optimized for storing large amounts of data (such as sensor data) at a high speed. It is also very flexible in what to store, you don't need to decide beforehand how the data will look.
There are other alternatives if you don't want to use Influx, such as Graphite, OpenTSDB or Prometheus. But influx is the one that we use in the Open Energy Playground, so that is why it is documented here.
Storing data
Create Database
Before we can store anything in influxDB, we need to create a new database. Open http://192.168.99.100:8083 in a browser to get to the influx web admin console.
Under the Query Templates button, select Create Database
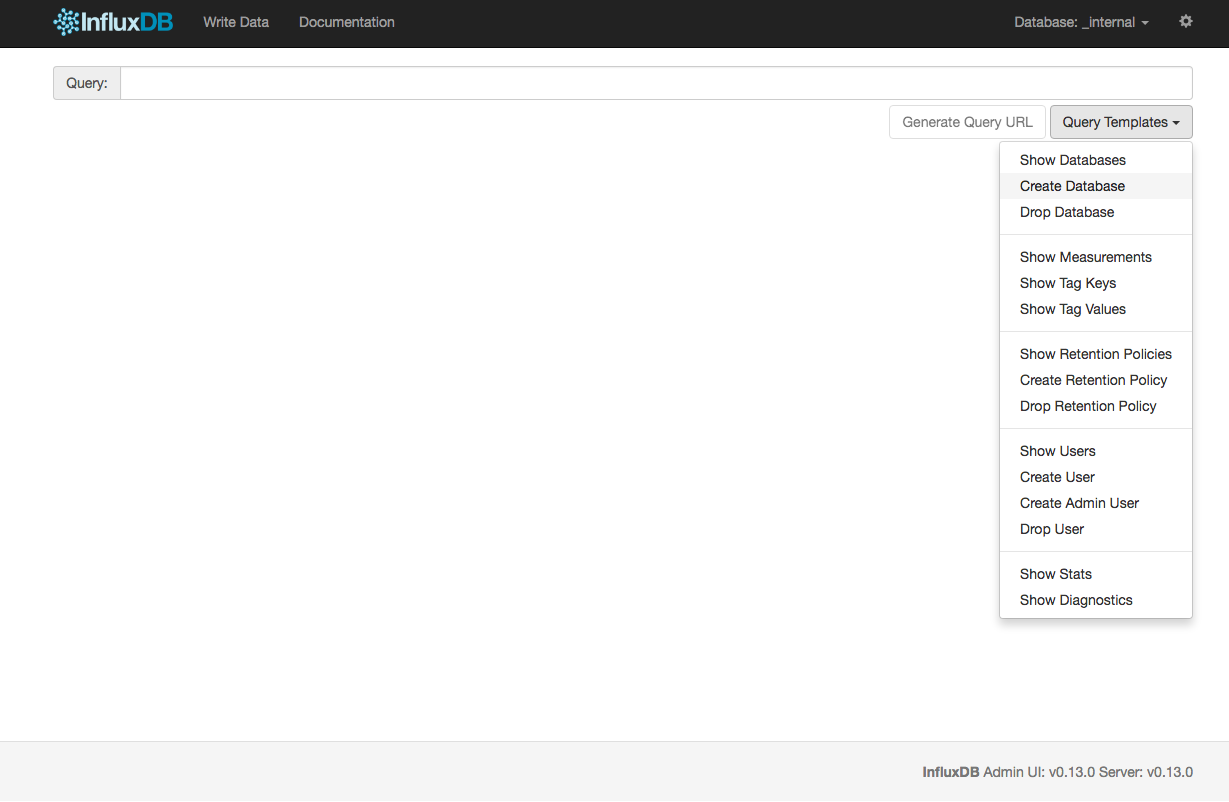
This inserts CREATE DATABASE "db_name" into the query field. Change db_name to whatever you want to call the new database. We are gonna go ahead and call it test, feel free to do the same!
CREATE DATABASE "test"
Press enter to run the command, you should see a message saying: Success! (no results to display)
Just to make sure that everything was successful, we run a new query to show all databases.
SHOW DATABASES
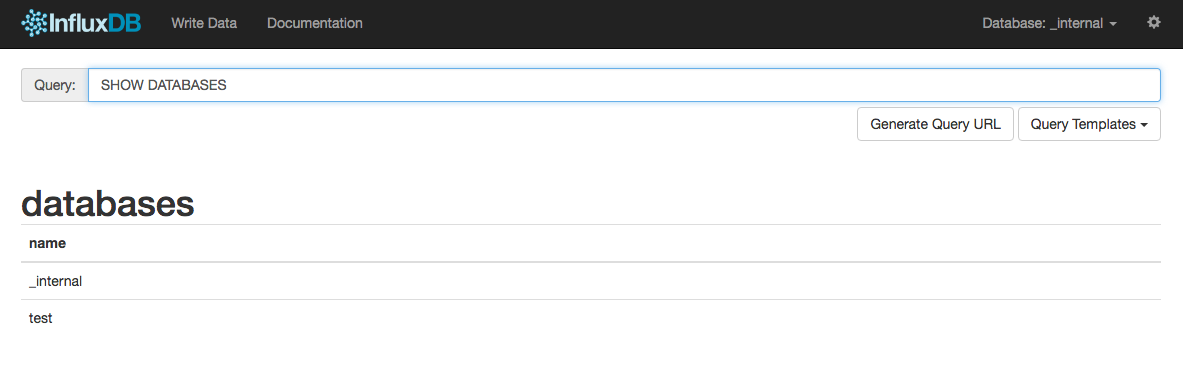
We see the new database in the list!
Put something in the database
There are many different ways of writing new data to influx. But for simplicity, we are going to do it from node-red, just like we did in First Web Visualization.
Open http://192.168.99.100:1880 in a browser to get to the node-red control panel.
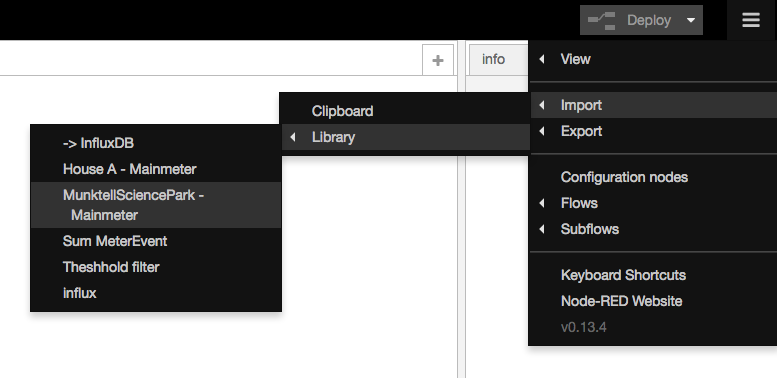
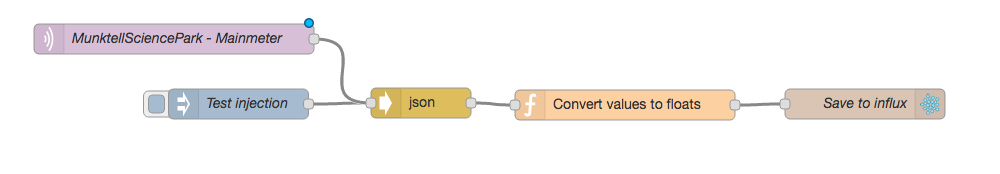
Import the example from the library called -> InfluxDB
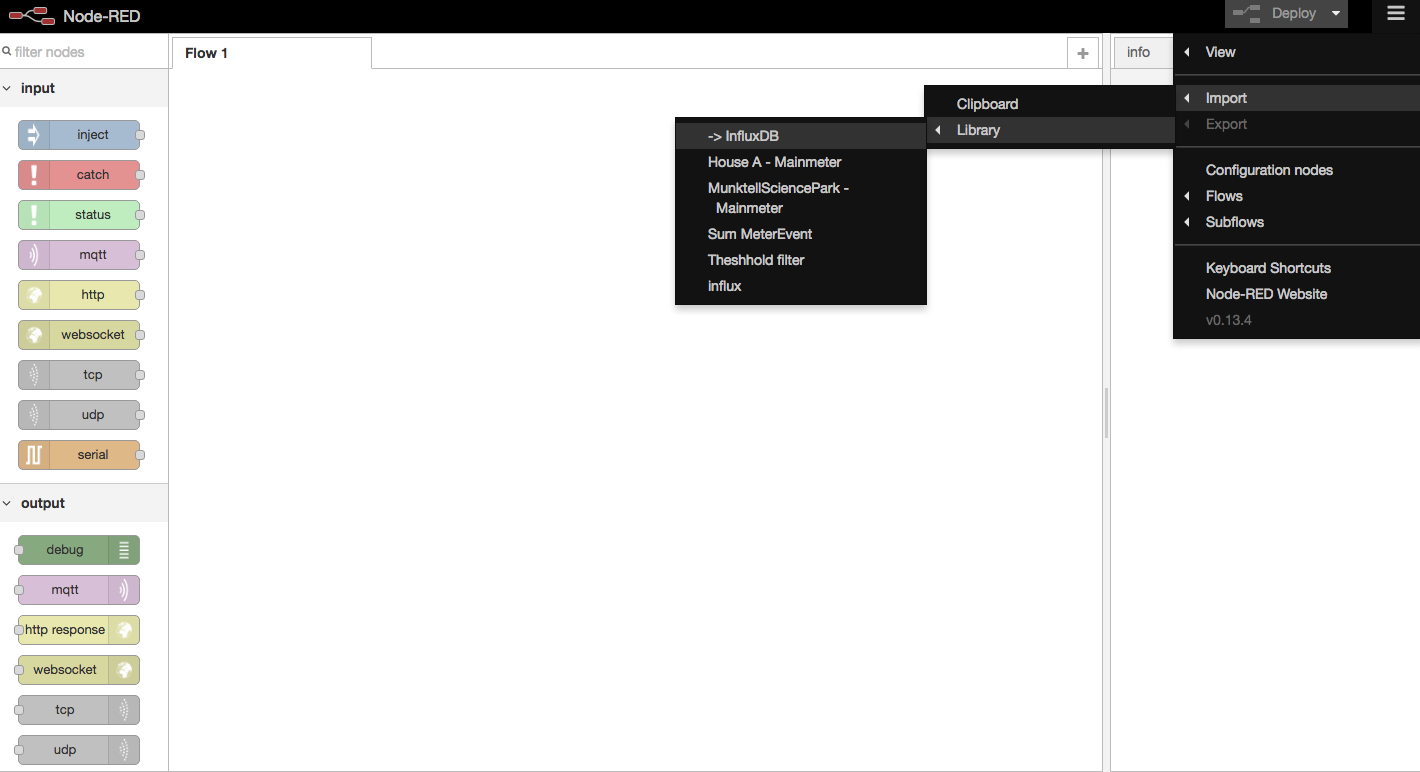
And place the nodes somewhere on the sheet.
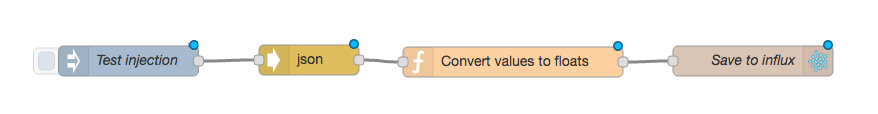
This example includes an inject node on the left where we can try to write example data to the database to see that everything works.
Press the small blue button on the left side of the Inject node!
You should get a message saying Successfully injected: Test injection
If the debug tab (under the deploy button in upper right) is empty (even after a few seconds) we should have successfully written our first point to influx!
But let's double check that ;)
Querying data in the web admin
Head back over to the influx web admin console at http://192.168.99.100:8083.
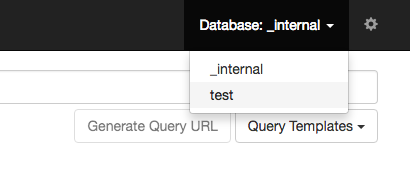
To query the data, we need to view a specific database. Select the database called test in the upper right corner.
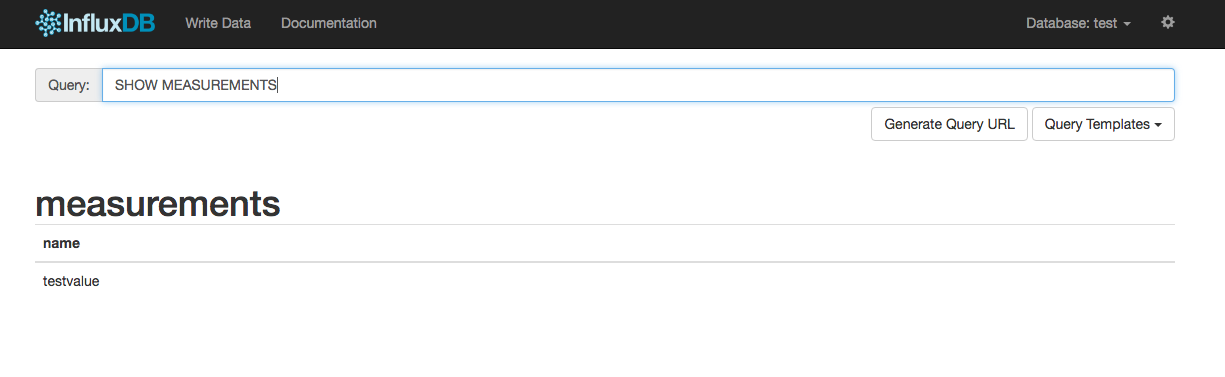
We want to see which measurements exist in this database, run the query:
SHOW MEASUREMENTS
This shows us that we have one measurement called test-measurement.
In influx there are many new concepts of how the data is organized, such as measurement, series, point etc. To learn more about these different words, see the InfluxDB documentation about Key Concepts.
Ok! Let's see if we have any points in this measurement. Run the query:
SELECT * FROM test-measurement
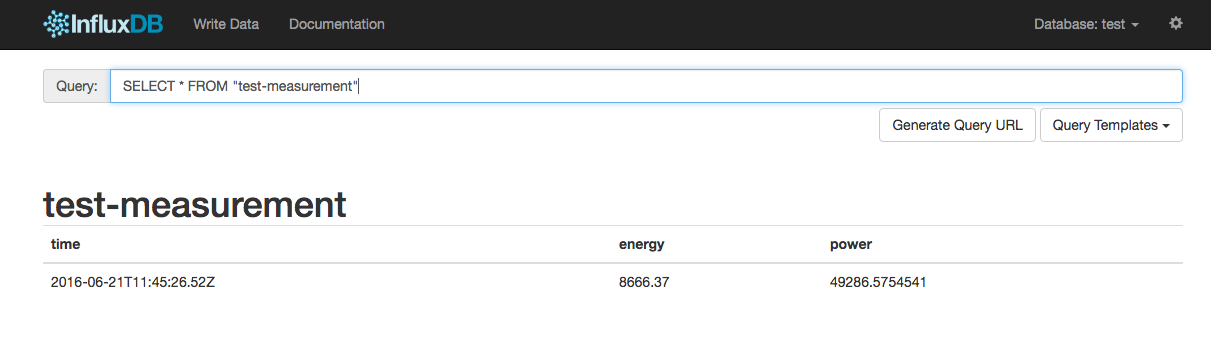
Aha! The measurement contains one point. This point has 3 fields: time, energy and power. That each contain a value.
Excellent!
Now let's get some real data in there.
Writing all points in a data stream
Now let's replace that inject node with some real data.
Head back to node-red at http://192.168.99.100:1880
From the library, import another node called MunktellSciencePark - mainmeter.
and place it above the inject node. Then connect it to the json node.
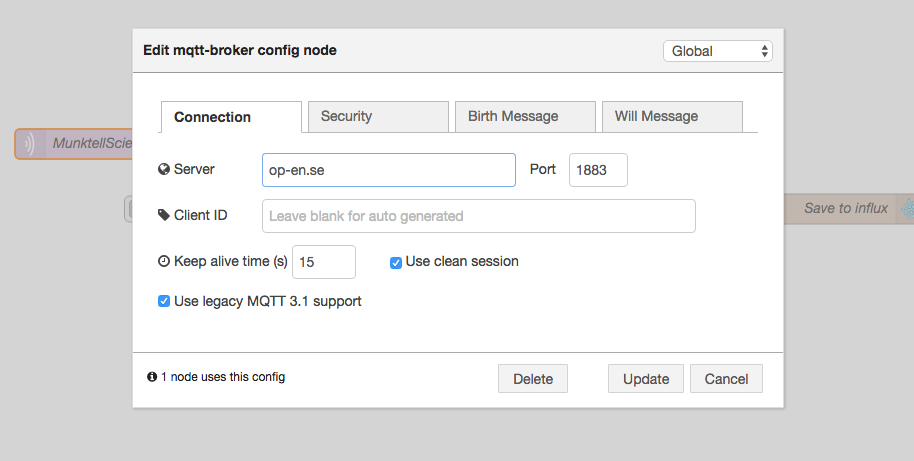
This is an MQTT input node. It lets us listen to an MQTT topic, and relay the data to something else (in this case influxDB). Double click the MQTT node to edit it. Press the pen on the right side of the server dropdown to edit the server settings. Set the server to op-en.se, leaving everything else default. Press update, then ok. And then deploy the new node with the deploy button in the upper right.
The mqtt node should show connected:
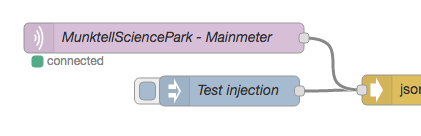
And data should (fingers crossed) be flowing into influxDB!
To check that, let's see if we have points in the measurement in the influx web admin.
SHOW MEASUREMENTS
now shows another measurement called Testsites/MunktellSiencePark/mainmeter/meterevent.
See the points by running
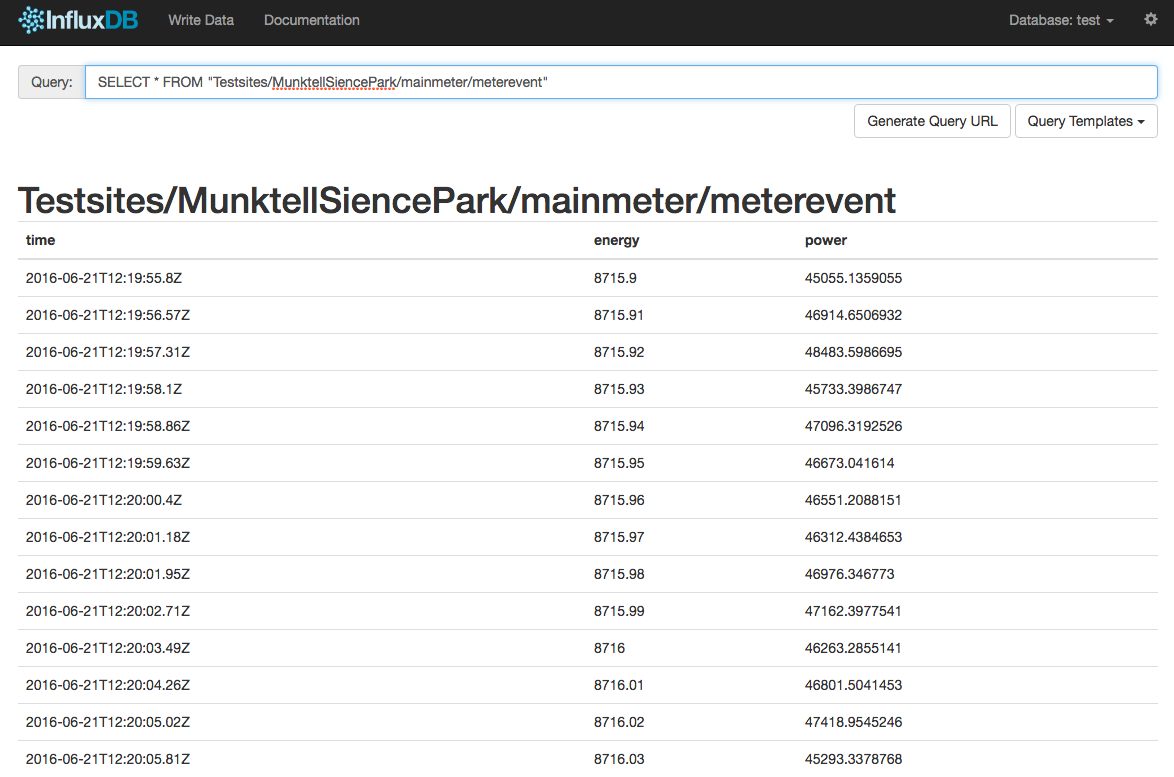
SELECT * FROM "Testsites/MunktellSiencePark/mainmeter/meterevent"
And we have lots of points in the measurement!
Let's make a graph!
Next
One way of making use of this data is to make a graph with it!