Results
On this page you will find a number of examples of how the open energy toolbox has be applied. The examples range form pure concept designs and work in progress to full implementations at some site.
Solstaden
Solstaden was a project where the open energy playground suite was applied as a backend to a webpage for showing solar energy production owned by the City of Stockholm. Data is collected every 10 minutes processed and made available through a rest api. In addition a Grafana instance allows for debugging of the data. Read more here.
View visualization:
http://www.soldata.stockholm.se/
http://www.soldata.stockholm.se/stats/dashboard/db/facility-overview
Keywords: processing, datacollection, solarproduction

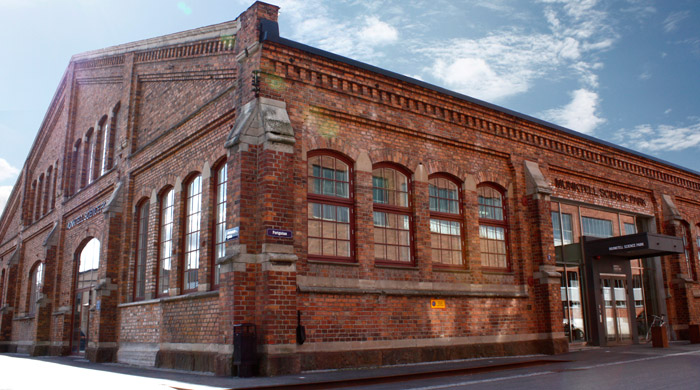
Munktell science park
In this project we set out to do an energy audit of the office hotell Munktell science park in the City of Eskilstuna. Realtime data of electricity usage as well as system schedules for ventilation and heating has been collected. This is a work in progress example. Read more here.
Keywords: data collection, analysis, schedules, work in progress
Household consumption
In this project we are monitoring two apartments with a number of both central meters as well as submetering on a number of electrical devices.
Read more here.
Keywords: data collection, analysis, schedules, work in progress

Electricity meter hack
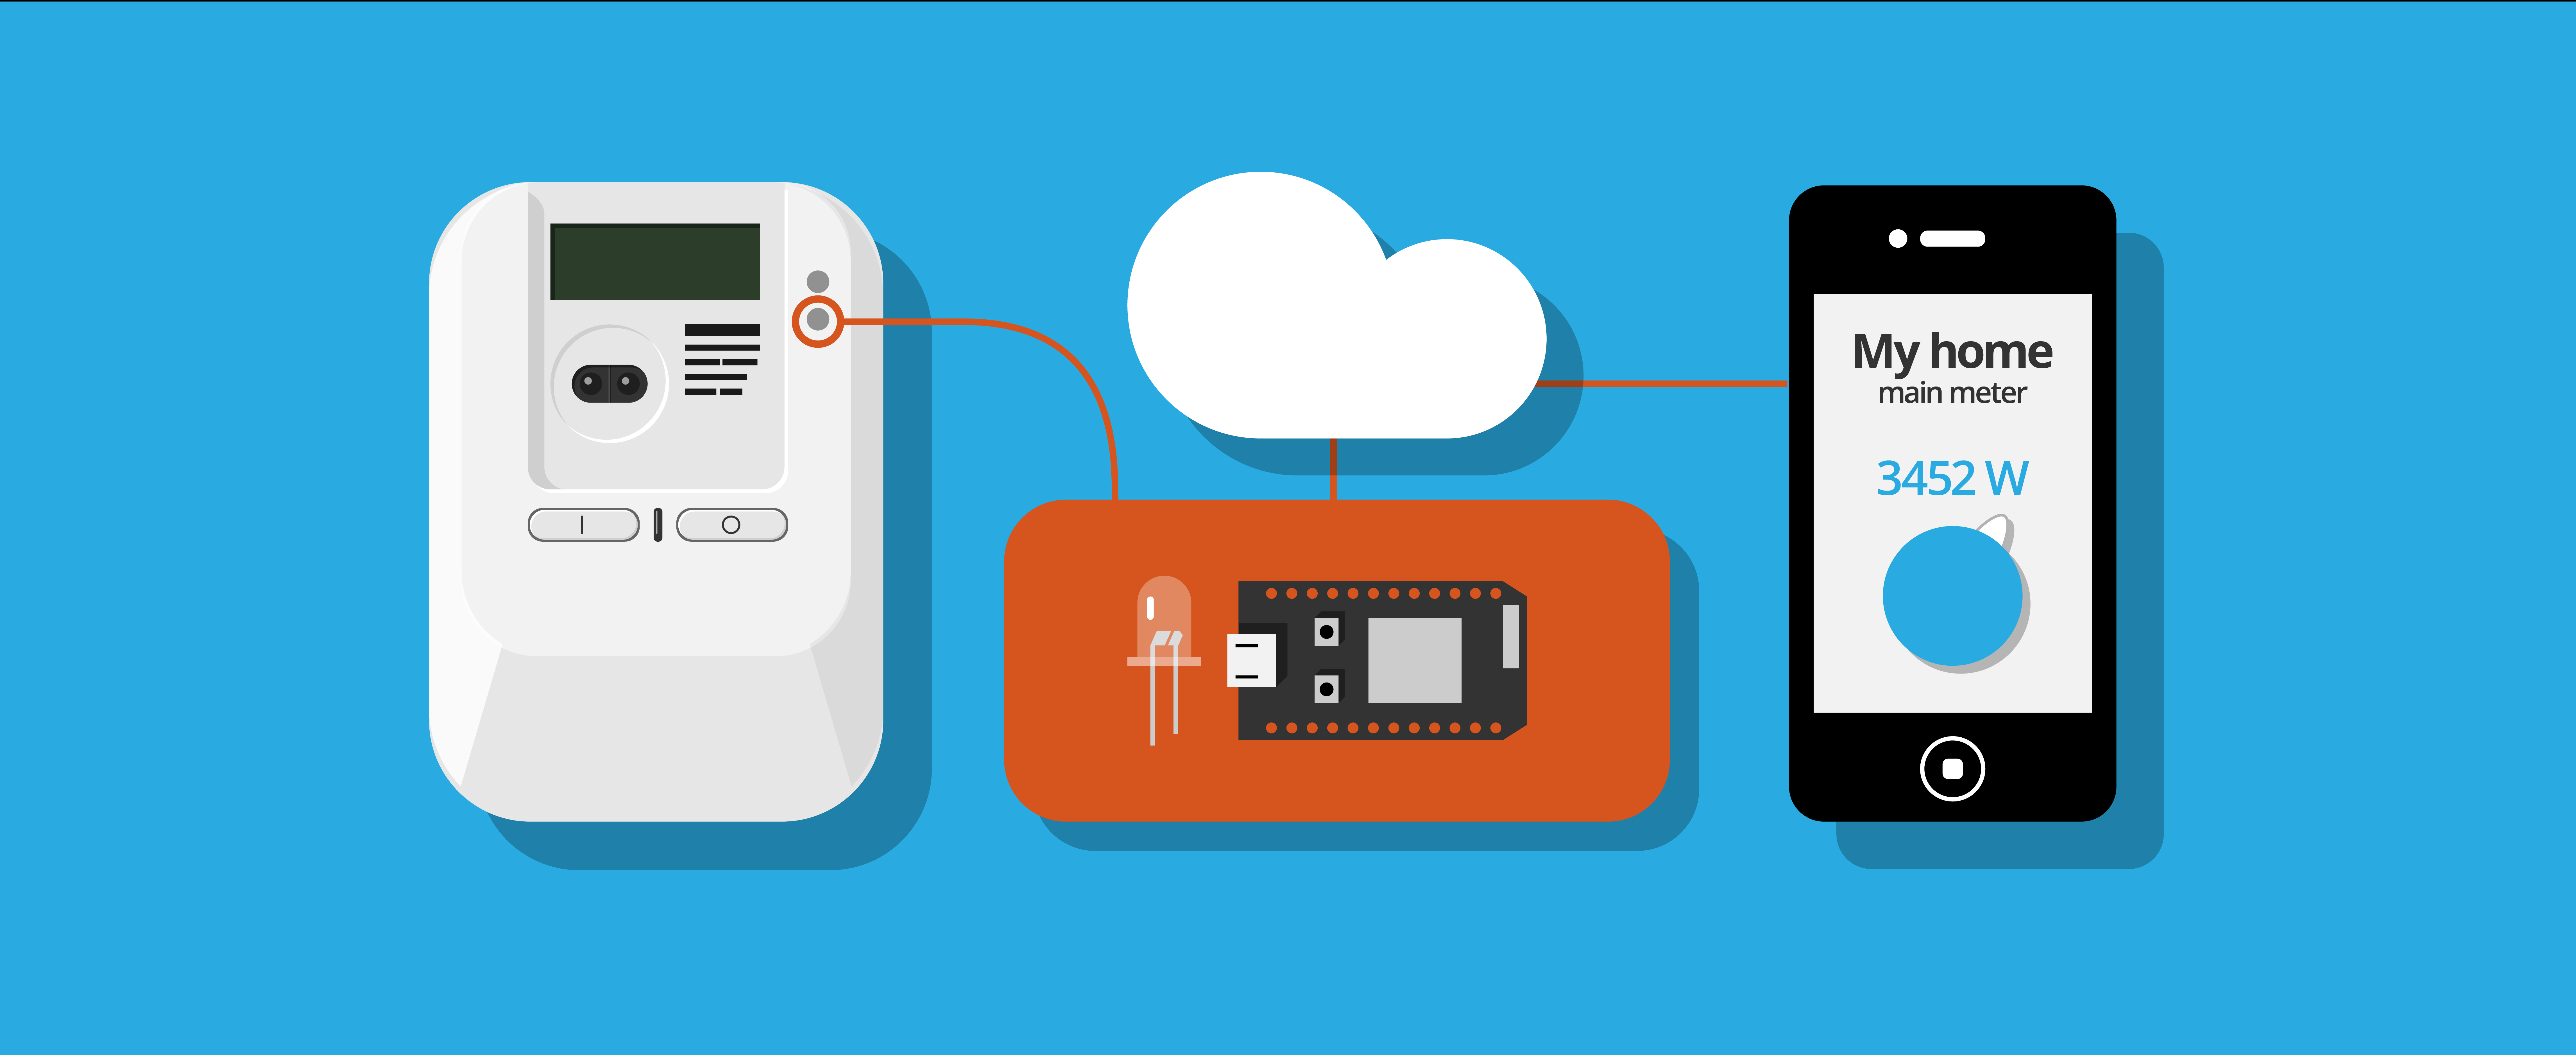
During two workshops at Internetdagarna 2016 and Jfokus 2017 we held workshops based on the Electricity meter monitor.
Read more about the workshops and how it went here.
Keywords: workshop, electricity meter, tutorial, event

The vacuum cleaner battle
During Jfokus 2016, we created the vacuum cleaner battle to illustrate how devices and IoT can be used to monitor energy usage in a vacuum cleaner and present it in a fun way.
Read more about the epic battle here!
If you want more detailed information on how the battle is set up, read the tutorial here!
Keywords: showcase, vacuum cleaner battle, vacuum cleaner, jfokus, hackathon, photon
Björklinge power grid
In this project the open energy platform was used to collect and visualise data from a small electric grid north of Uppsala. The solution constitutes a very cost effective way for the operators of the grid keep track of the status of the network.
Read more here.
Keywords: data collection, visualization, power grid surveillance
Watt-s
Watt-s is a company that aims to make it simple for people to invest in solar production. Their idea is that you should be able to buy a share of 1W for about €2.5. The open energy playground toolbox has here been used to collect and process data as well as to create a desktop app where the owners of solar power can monitor their production and determine what they can power with it.
Read more here.
Keywords: data collection, visualization, user testing
