Visualizing energy and temperature using a Particle.io Photon and a NeoPixel-ring
The Particle.io Photon is a powerful Wifi-connected micro-processor. Development is done via the web and a good amount of libraries are available for different tasks. Using a combination of MQTT-, JSON- and HTTP libraries a vibrant energy meter can be created using the Photon and an Adafruit NeoPixel-ring. This article does not go into too much detail, it rather focuses on the concepts of visualization using IoT-gadgets and connecting information flows using clever techniques such as MQTT. For details, see the source code link at the bottom of the article.
Getting started
Parts needed:
Other things needed:
- A server for providing local sunset and sunrise data – Domoticz is used here.
- A weather API service like yr.no or SMHI – SMHI is used here.
- A connected meter for measuring household power available either locally or via the web – An Elvaco CMe3000 is used here. But an ELIQ Online or similar will work just as well.
- A server for gluing together data from different API:s or energy meters using MQTT.
The basic setup
The Photon communicates with a set of API:s. These are in this case available on a server on the local network. However, any usable API that can be found anywhere can of course be used. The Photon also communicates via MQTT. It connects to a Mosquitto server on the local network. The information sources are as follows:
MQTT:
- Power and energy information
REST JSON API:s:
- Sunrise and sunset times for dimming the LEDs depending on time of day.
- Weather forecast for rain/snow warning as well as temperature.
Visualizing power info
The NeoPixel Spark 24 contains 24 NeoPixels ordered in a circle. This opens up for any type of dial visualization. Showing energy in this example is done using a classic green to red setup. Each LED that lights up implies 100W of household power usage. Scaling color can be tricky. For a good looking transition from green (low power) to red (high power) a HSV color scale is used. To realise why this is better than using a linear RGB color scale, see this:
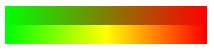
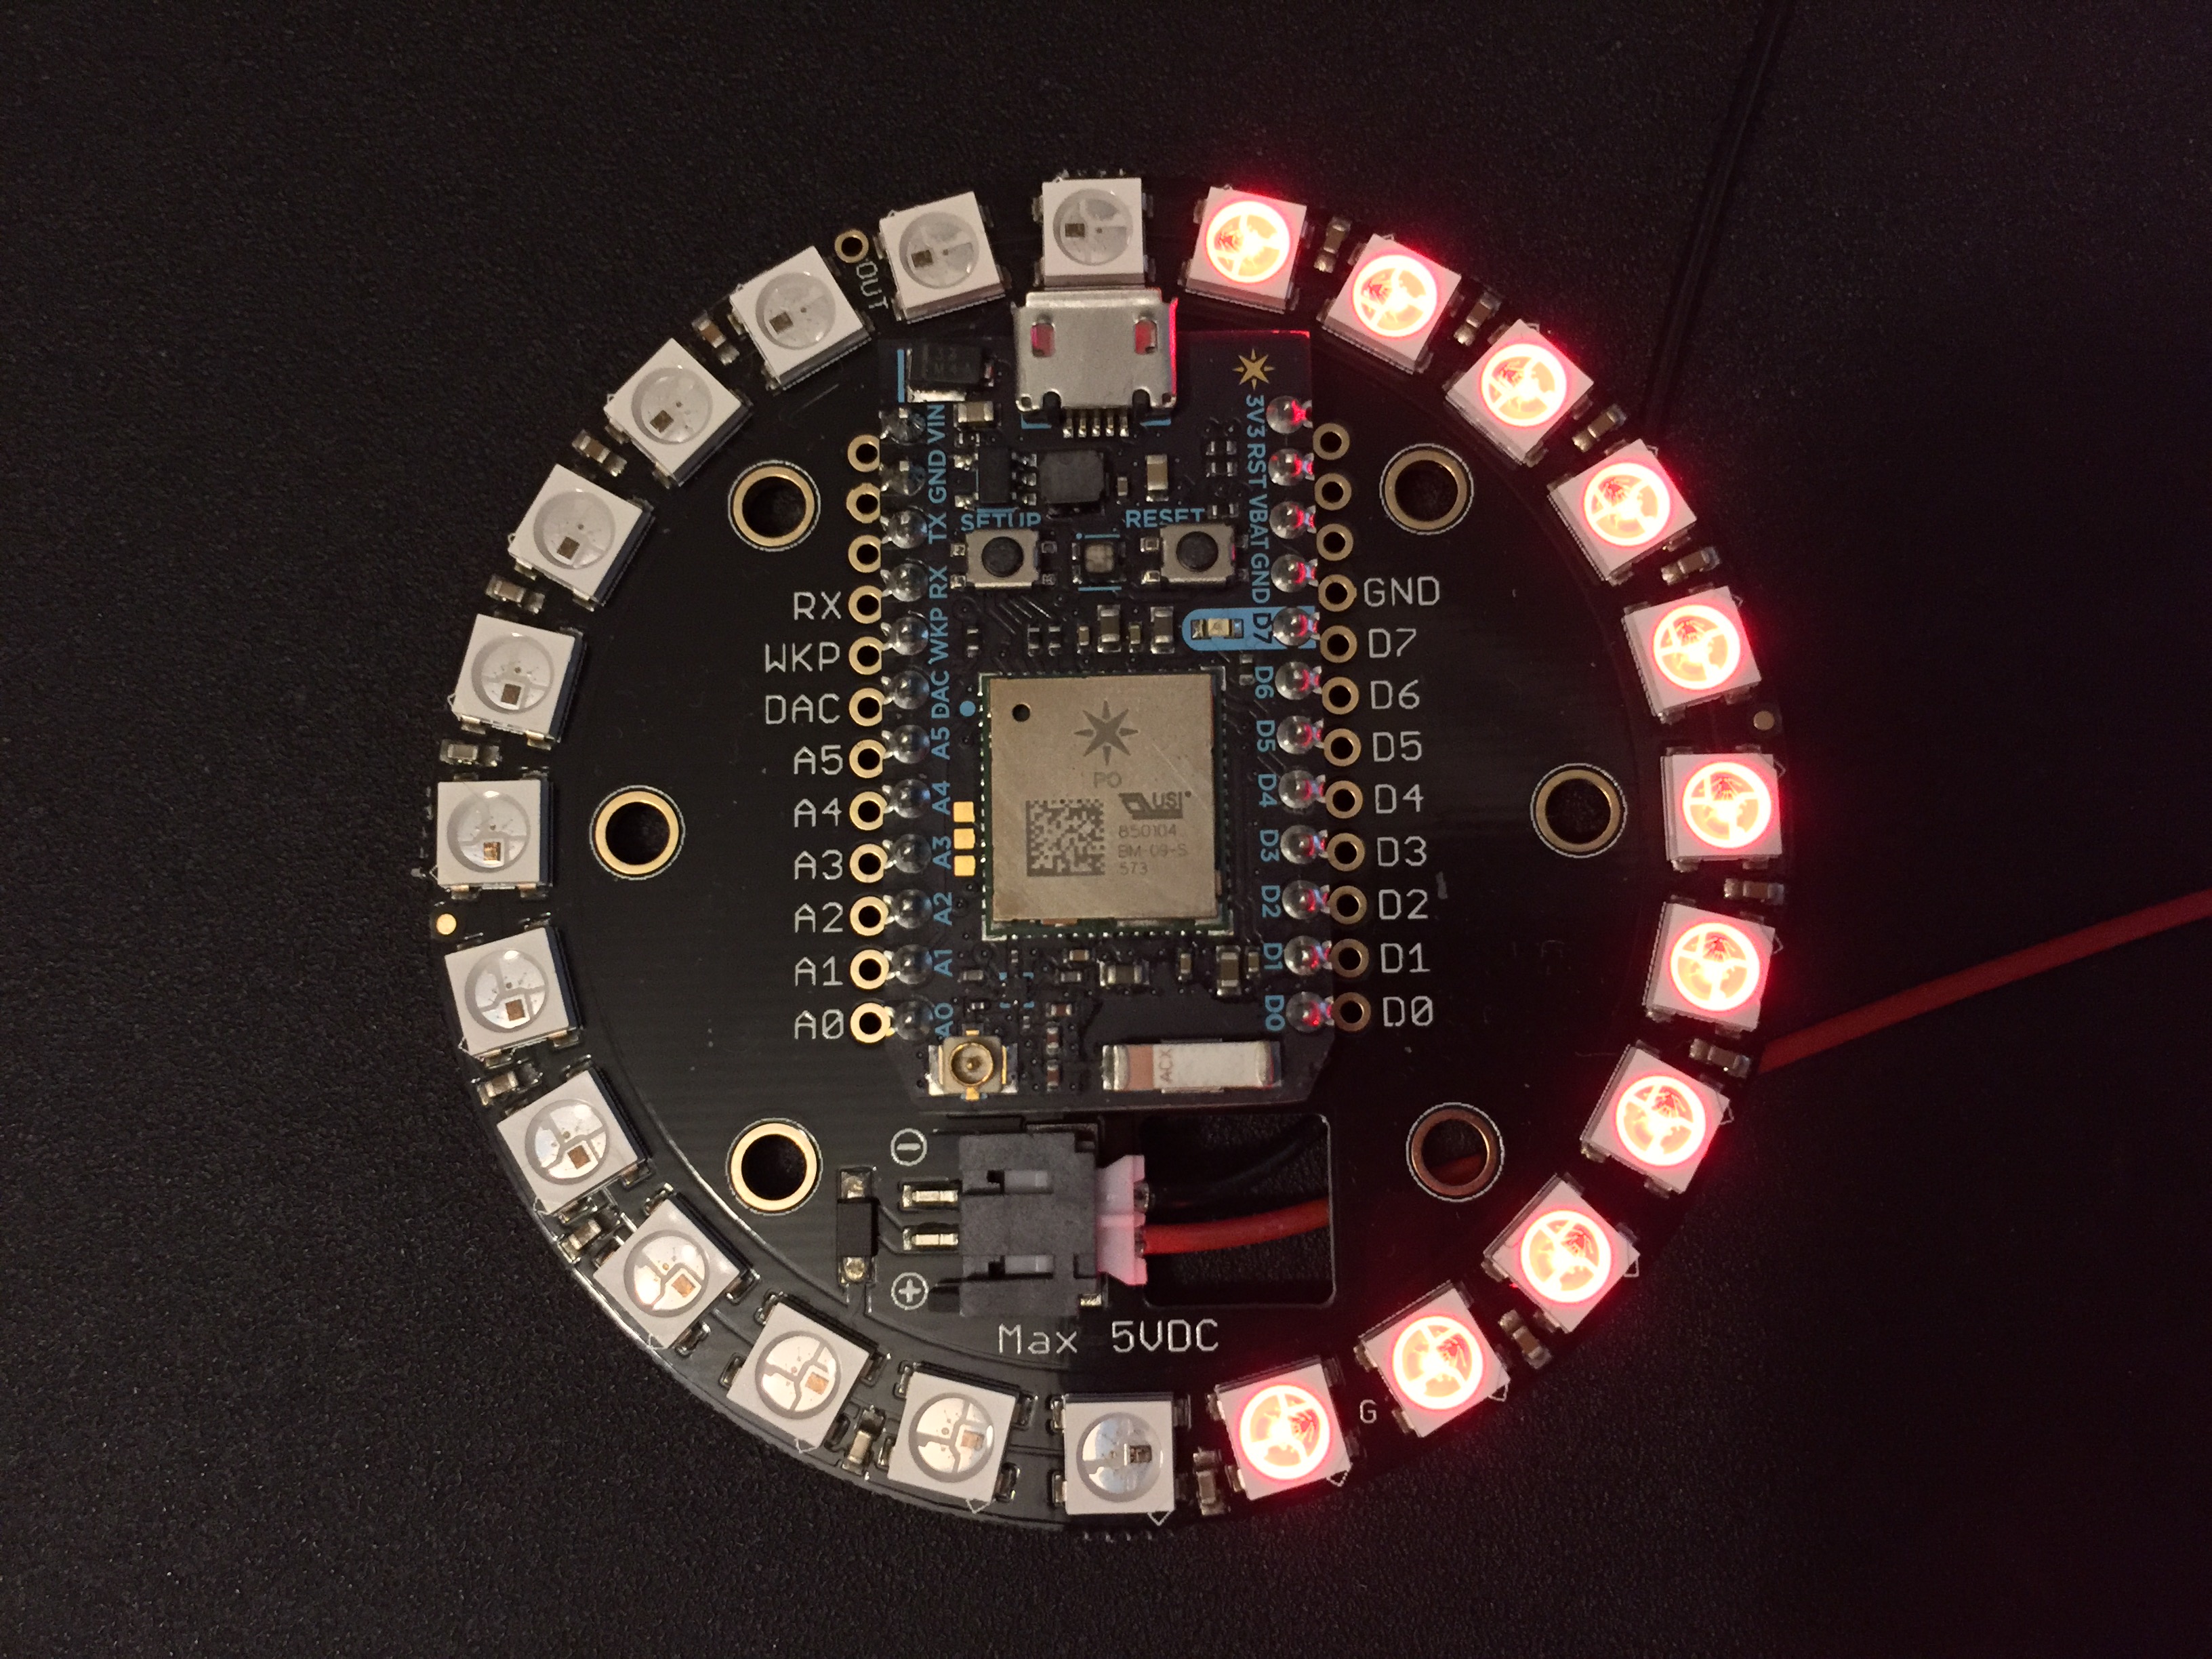
The top part of the picture shows a linear RGB gradient from green to red. Between green and red is some dull brownish color which does not look good and does not improve visibility when reading a metered value. The lower part however shows why HSV is a superior choice for this type of color gradient. In between green and red is a yellow area. Perfect for visibility (unless your color-blind in the red-yellow-green part of the color spectrum, which some of you probably are, but that is beyond the scope of this article). With this in mind, a power meter was implemented, starting at pixel 14 (counting from 12 o’clock) and ending at pixel 9. Pretty much like a speed dial in a typical car. For small power usage, the dial is mostly green, up until some 200-300 W, where it starts to become yellow, and somewhere around pixel 2 where it becomes yellow and then at pixel 7-9 becomes red. The end value at pixel nine is 1900 W of power usage and above. This means using the vacuum cleaner or stove will maximize the meter. But that is by design in this case. What I want to capture is the low power consumption. This is useful when leaving the apartment/house, going to bed or just being energy aware. Using high power equipment is in most cases obvious, however forgetting to turn off unnecessary lights, the coffee machine or computer when going to bed or leaving the house is if not dangerous, a good way of wasting energy and money. The result of this can be seen here:
The colors are much more vibrant in reality than what my iPhone-camera can capture.
Visualizing outdoor temperature and precipitation info
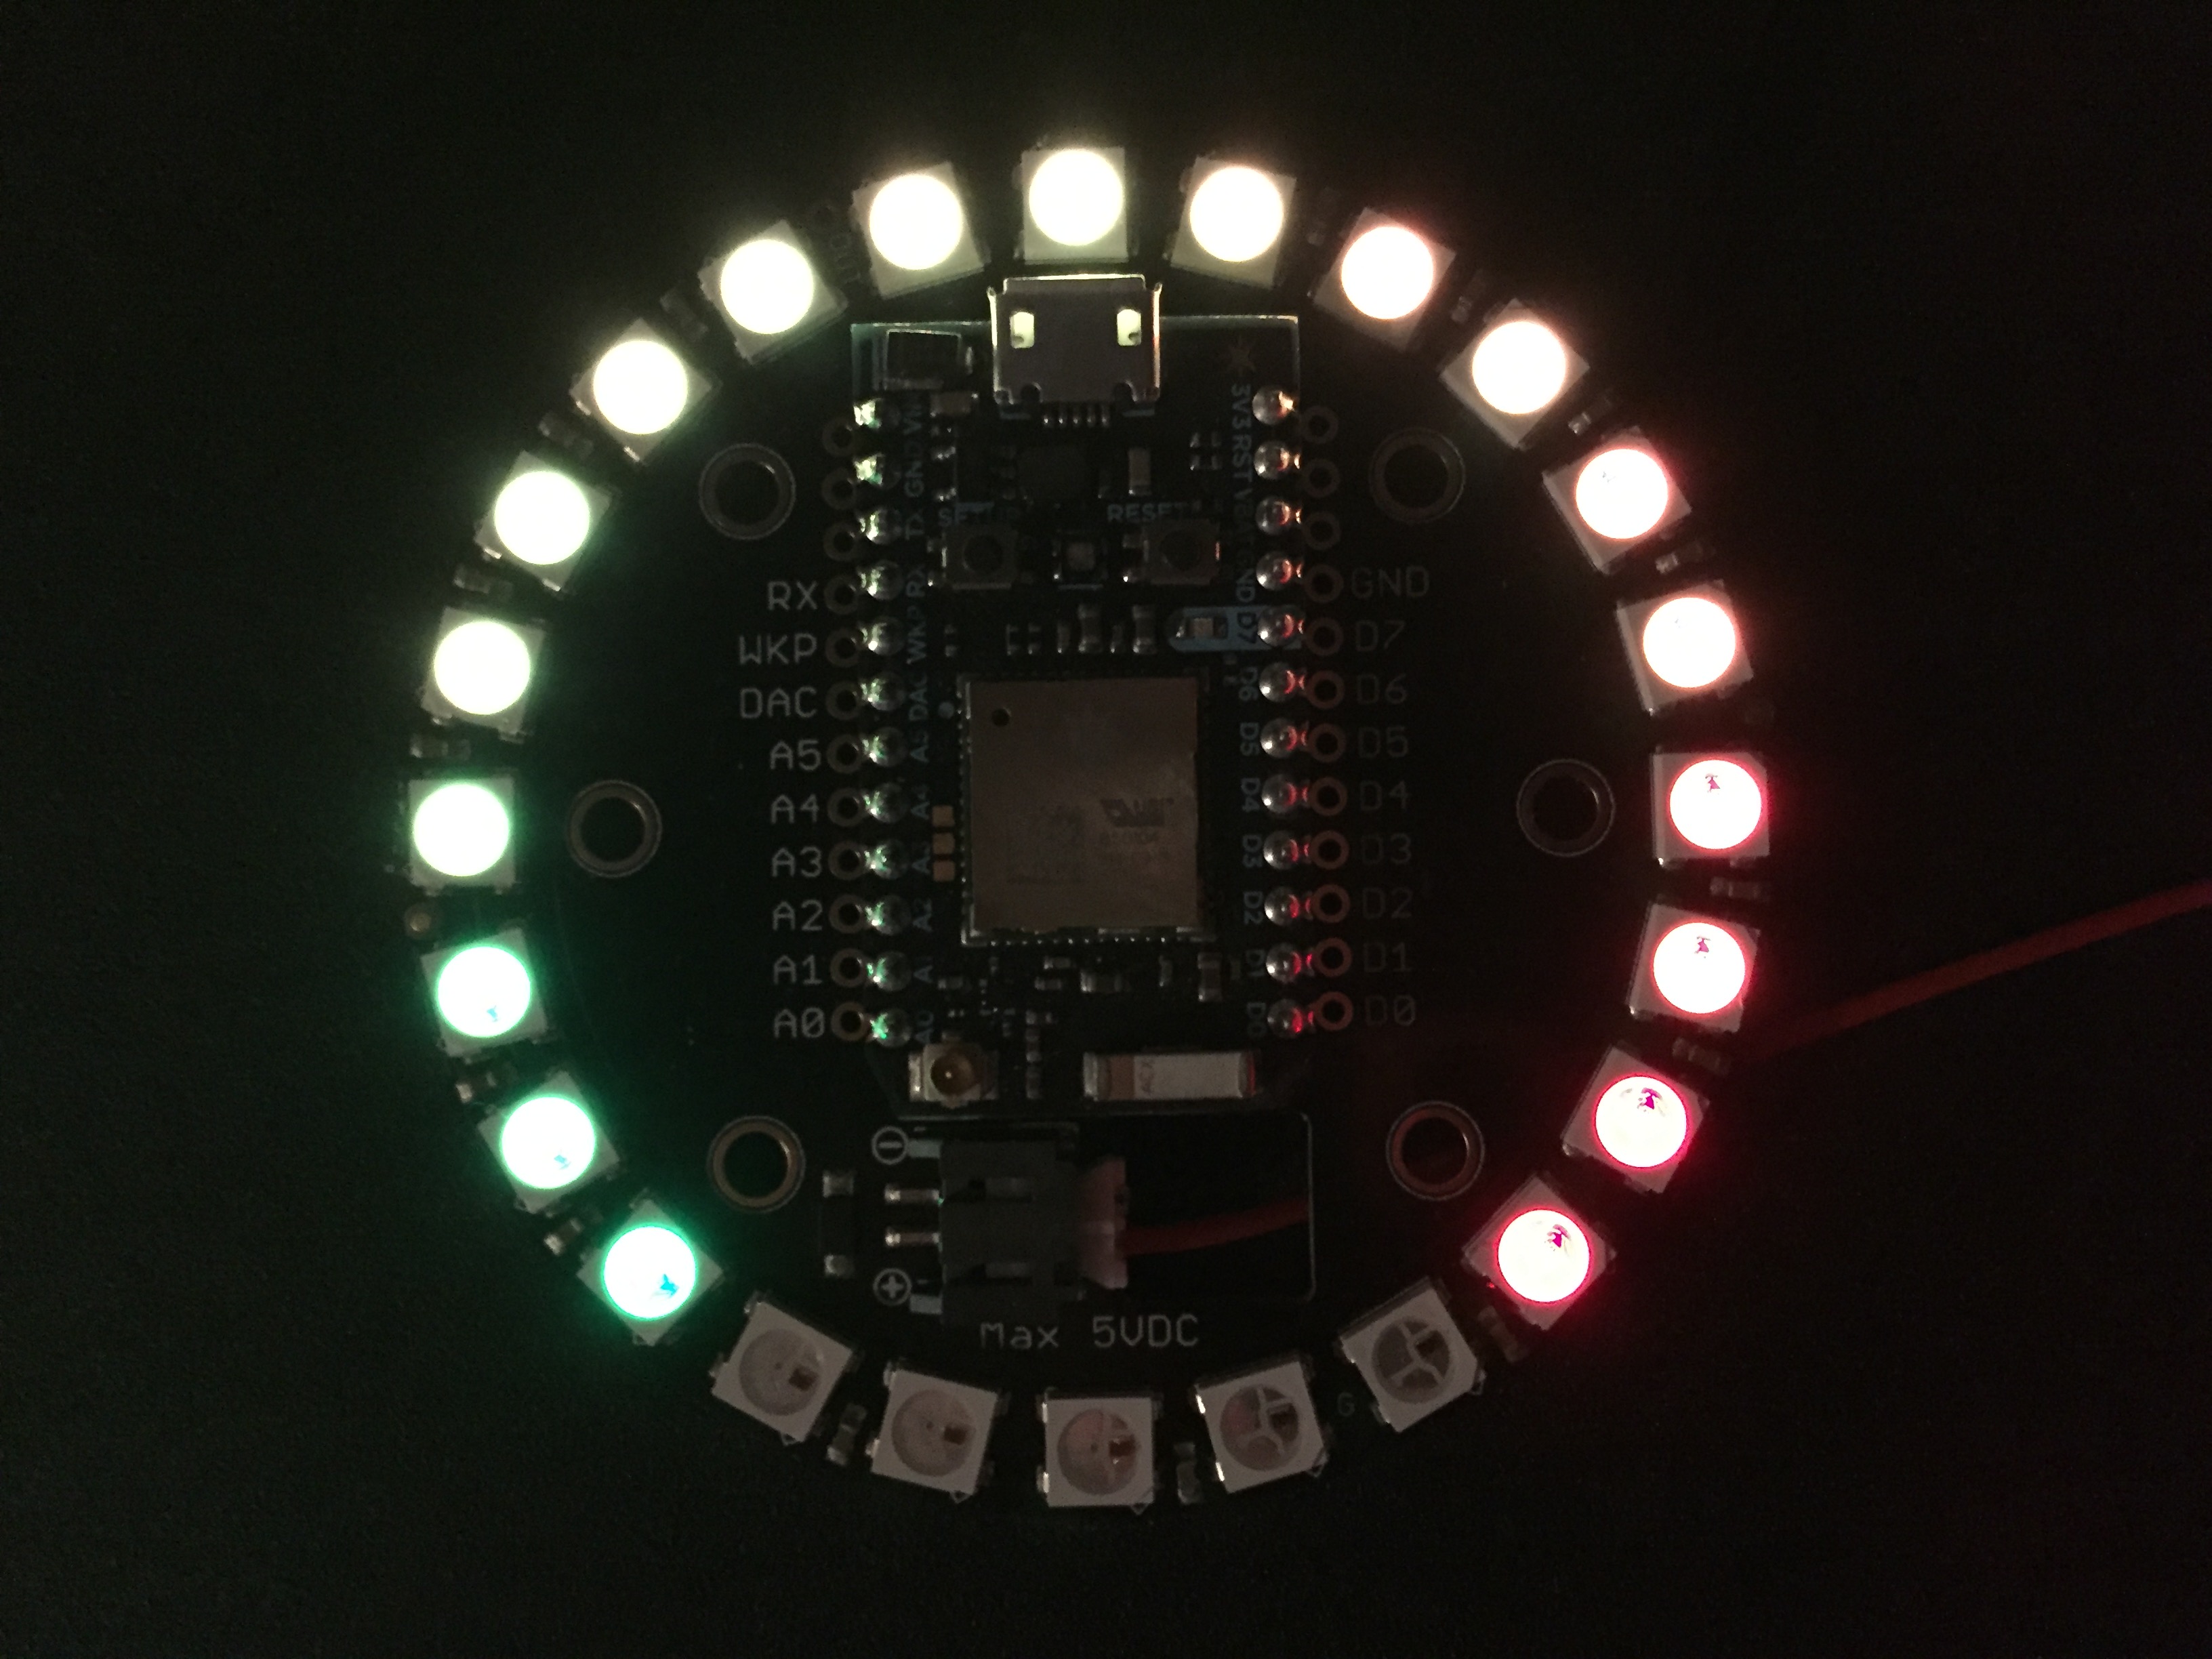
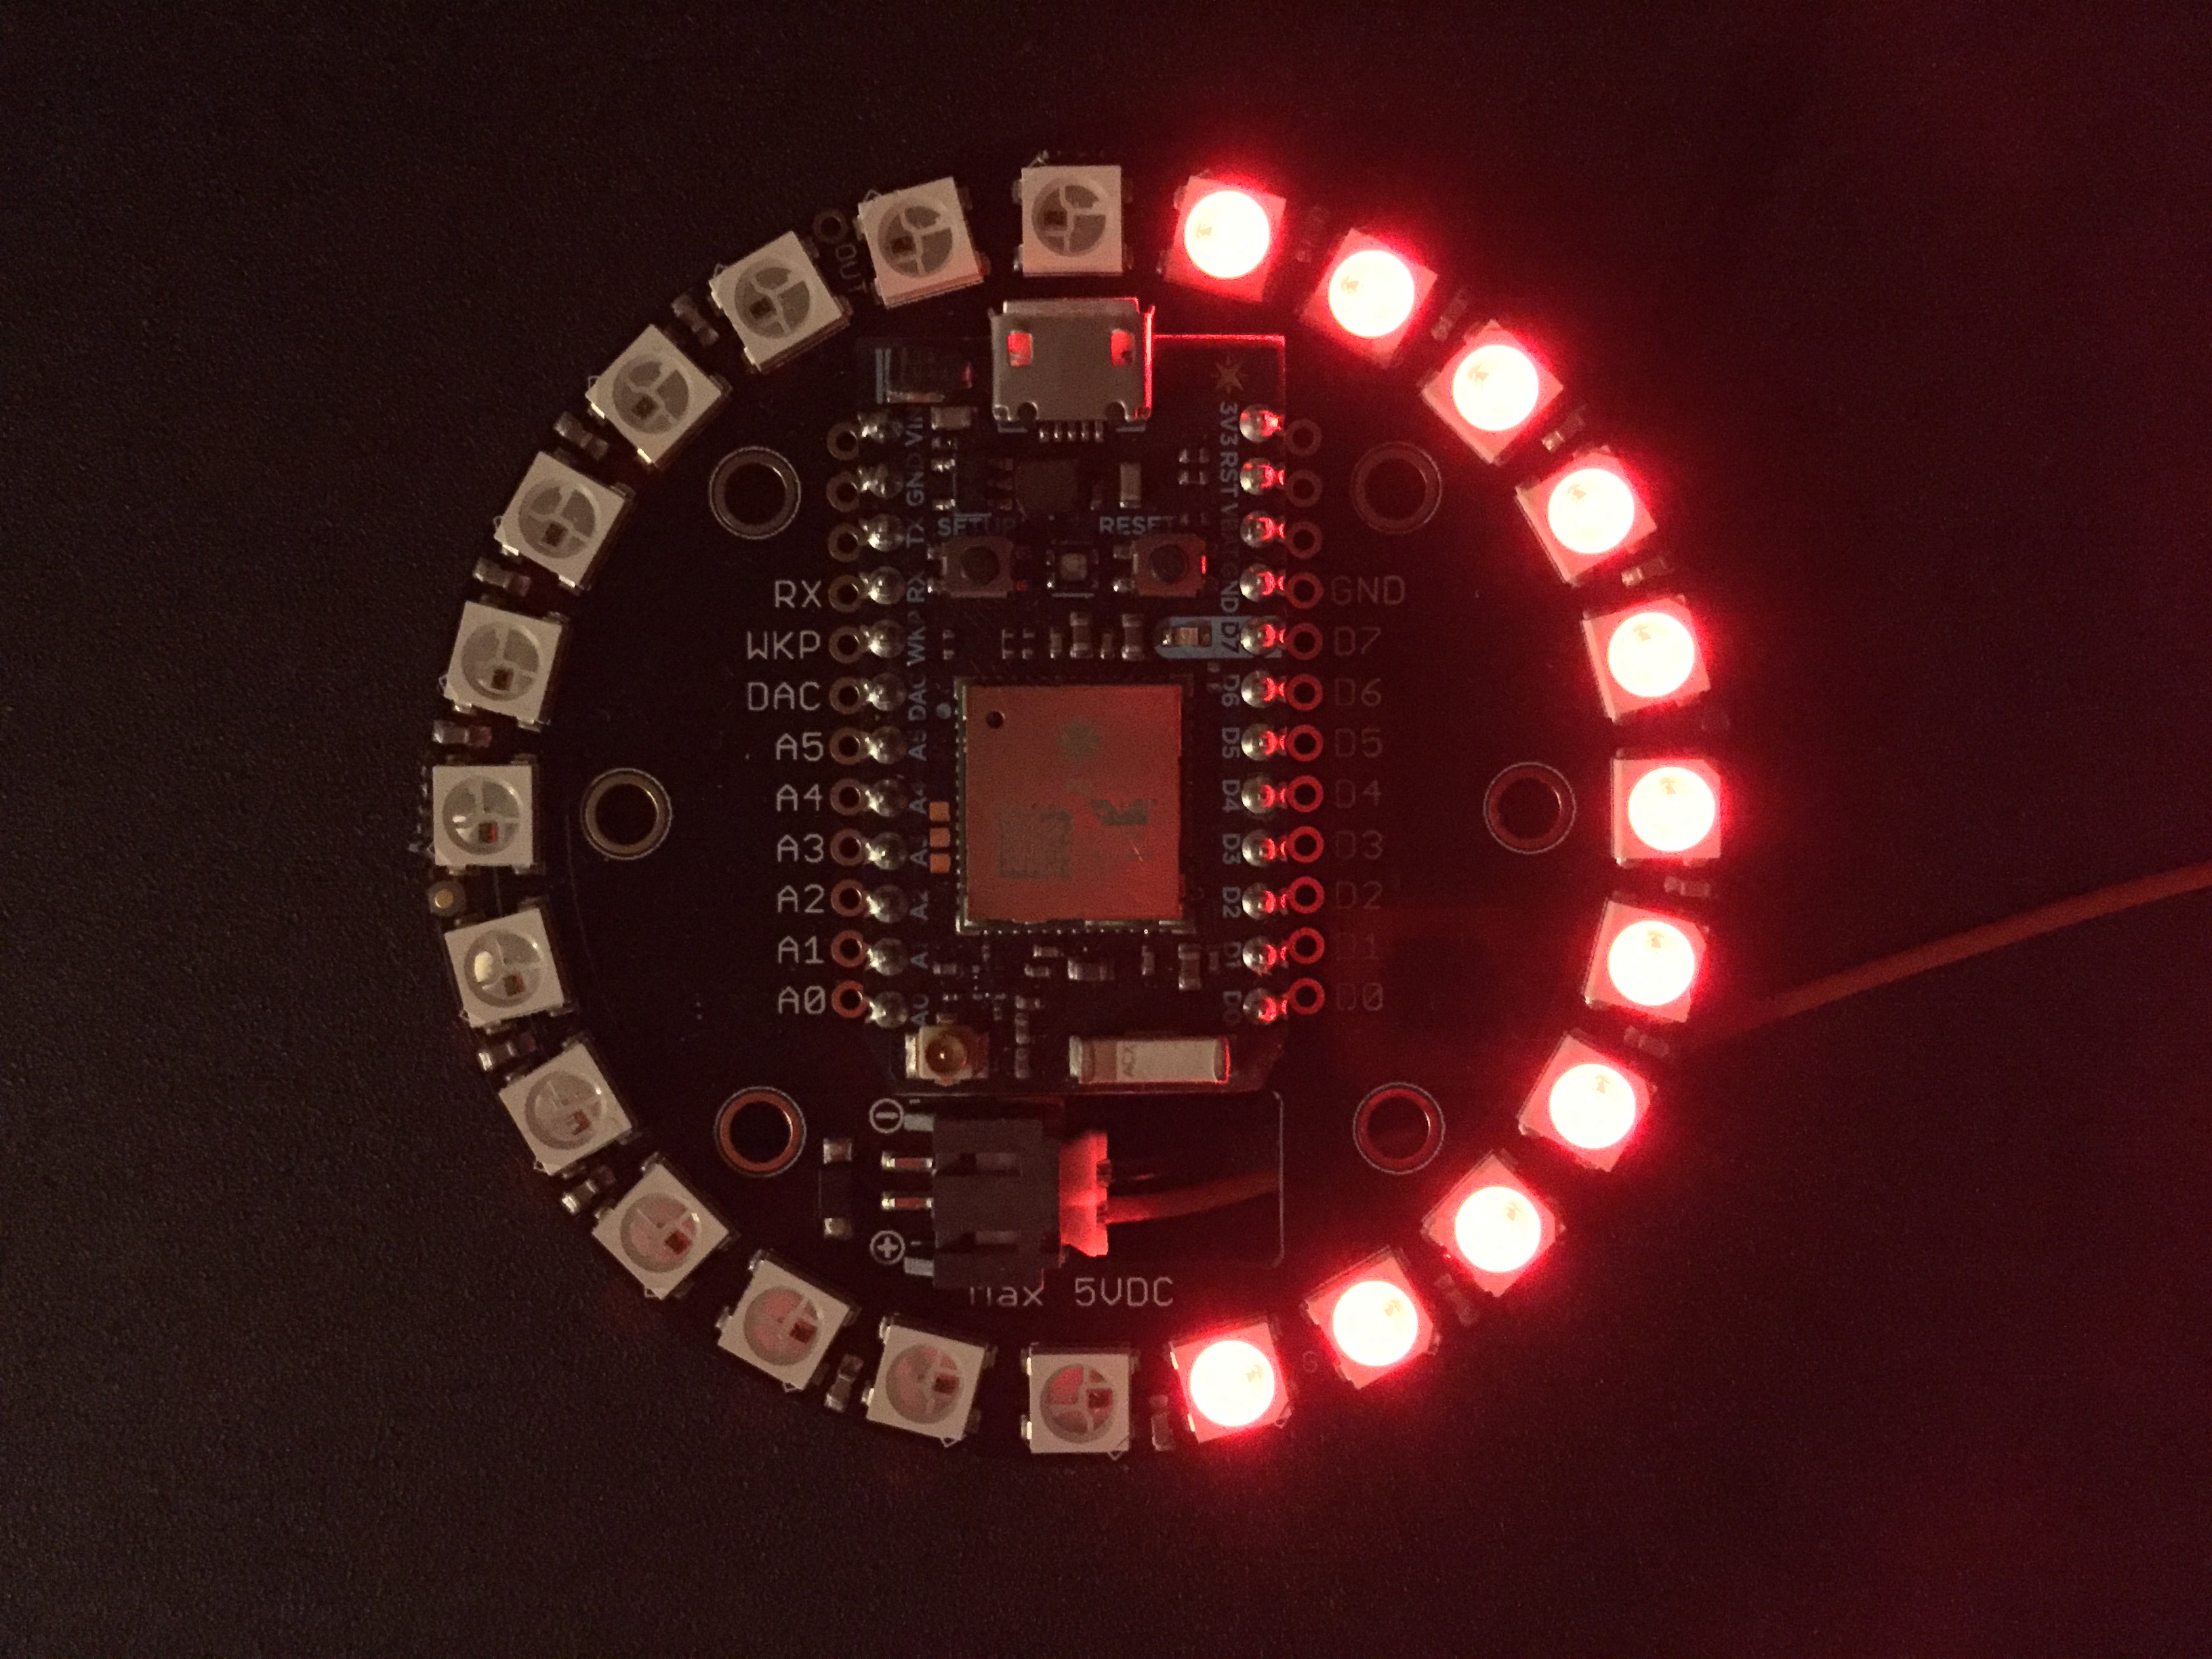
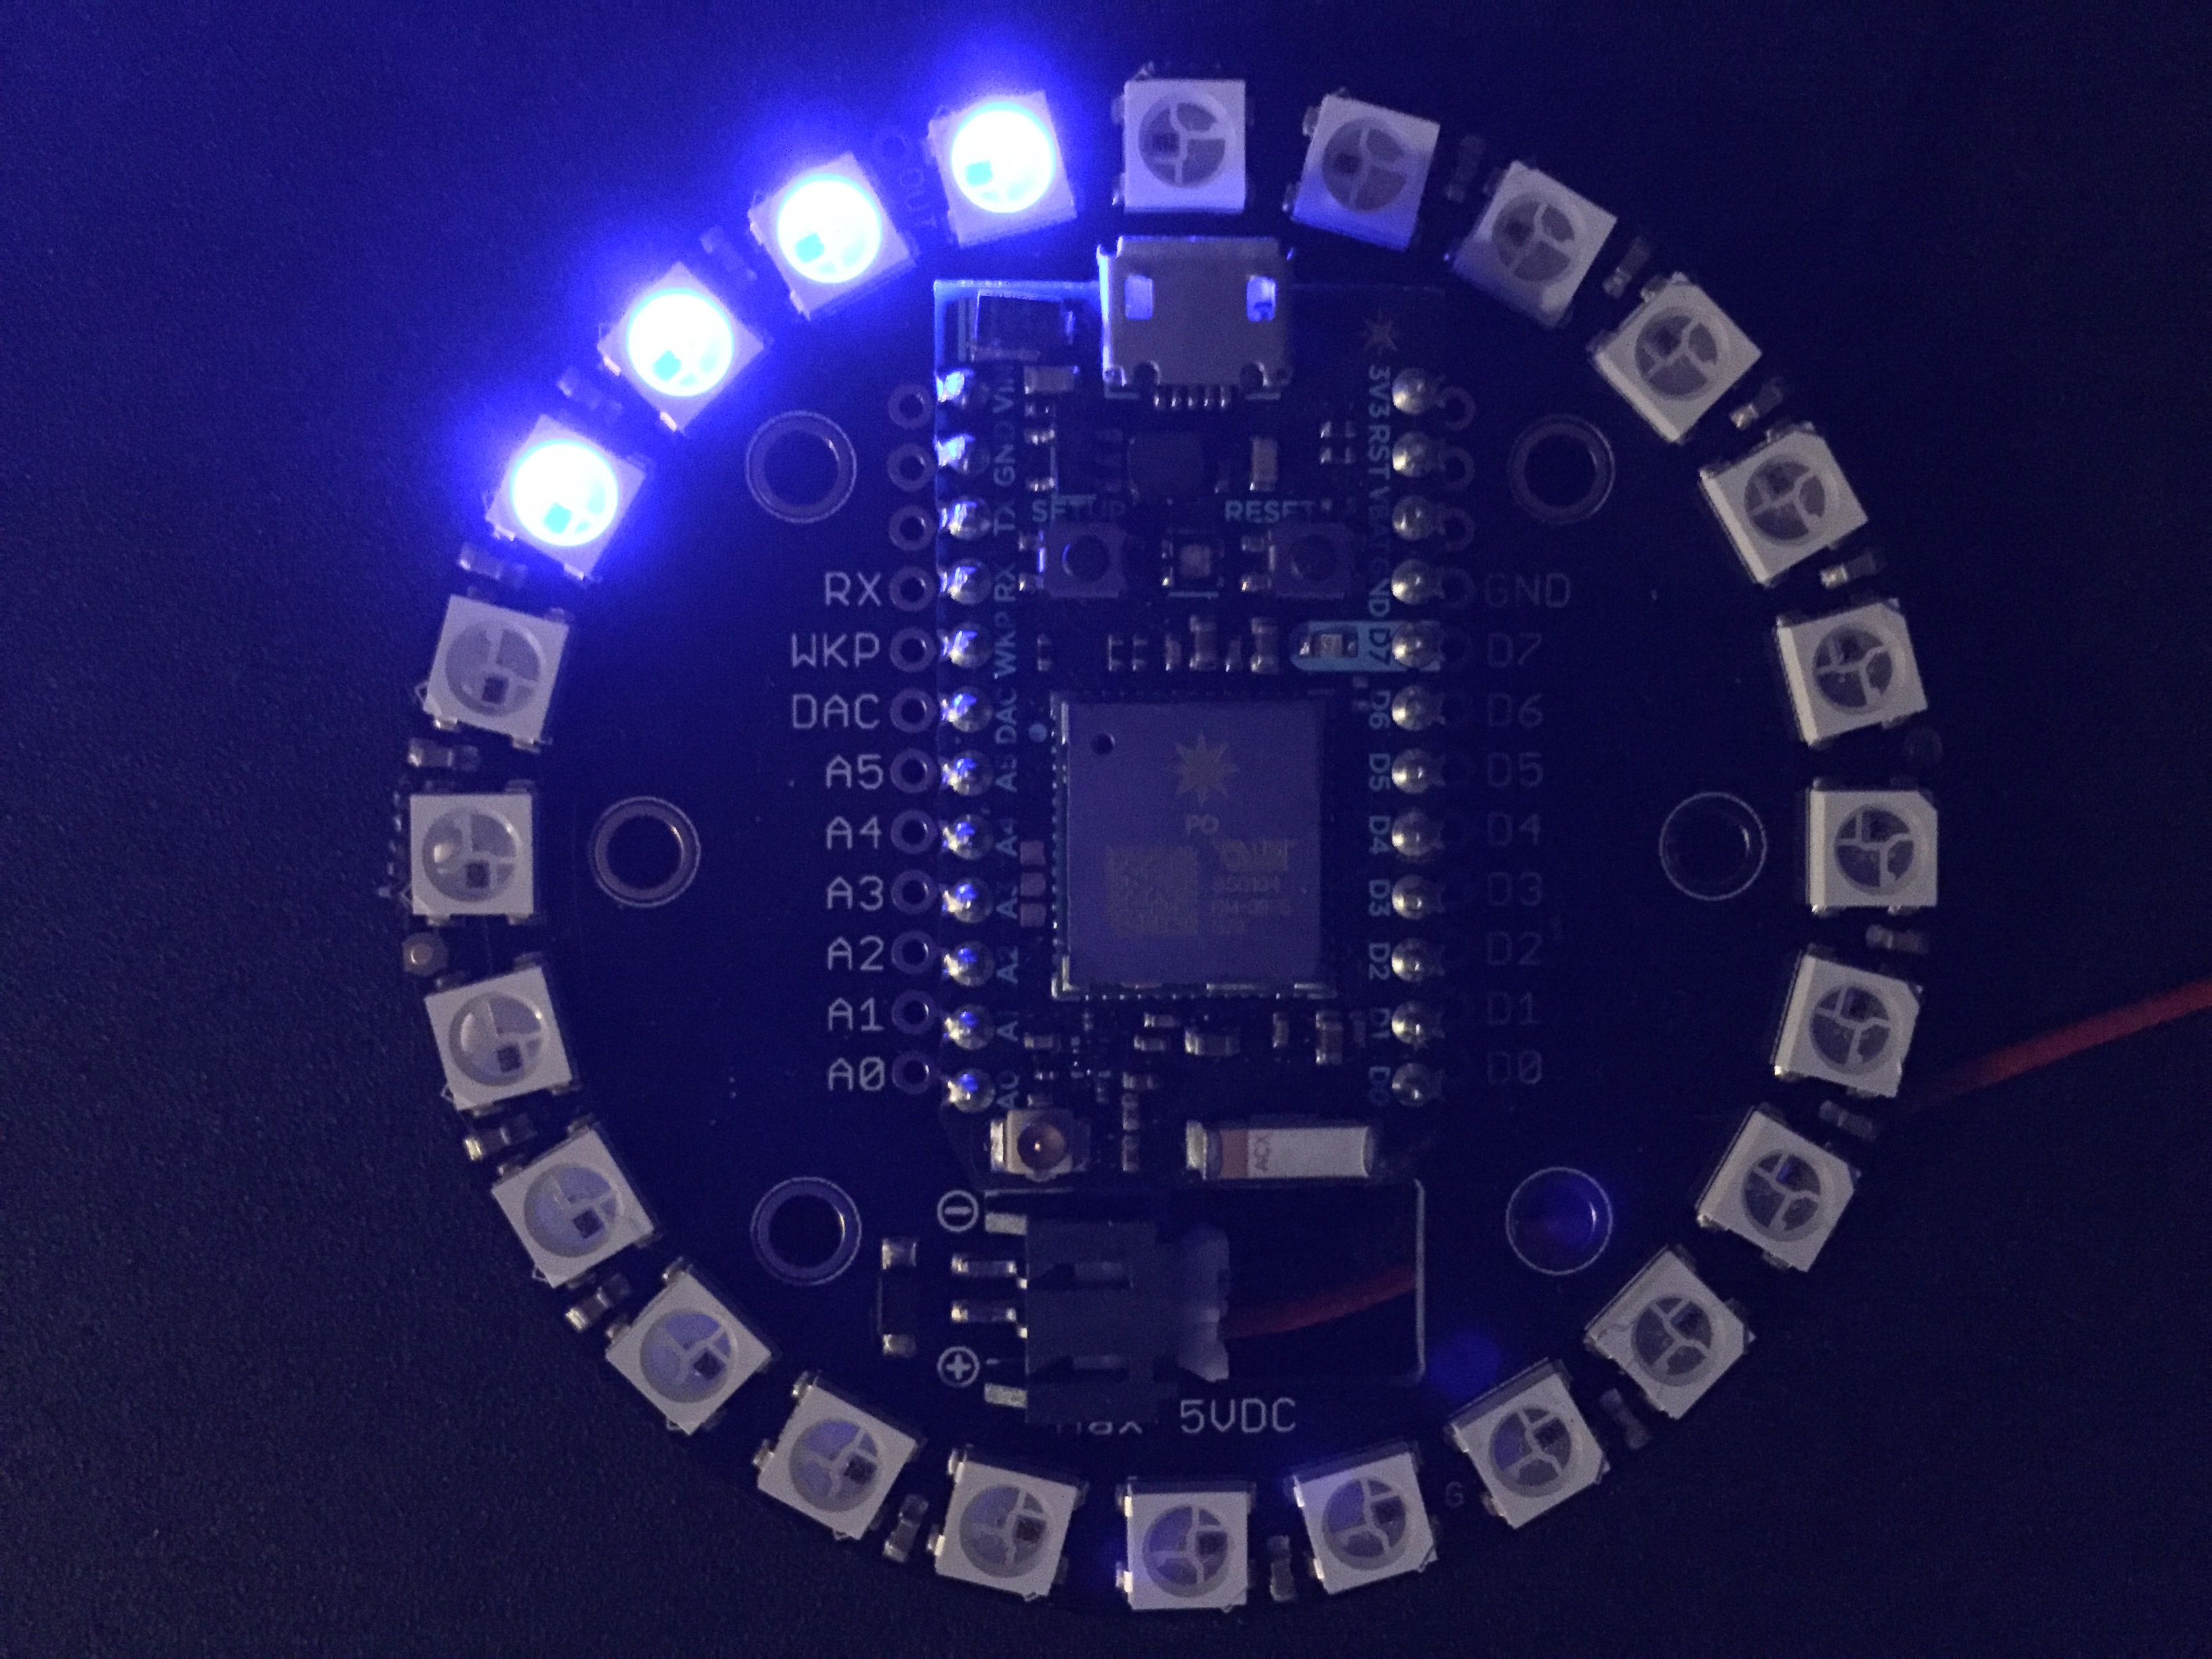
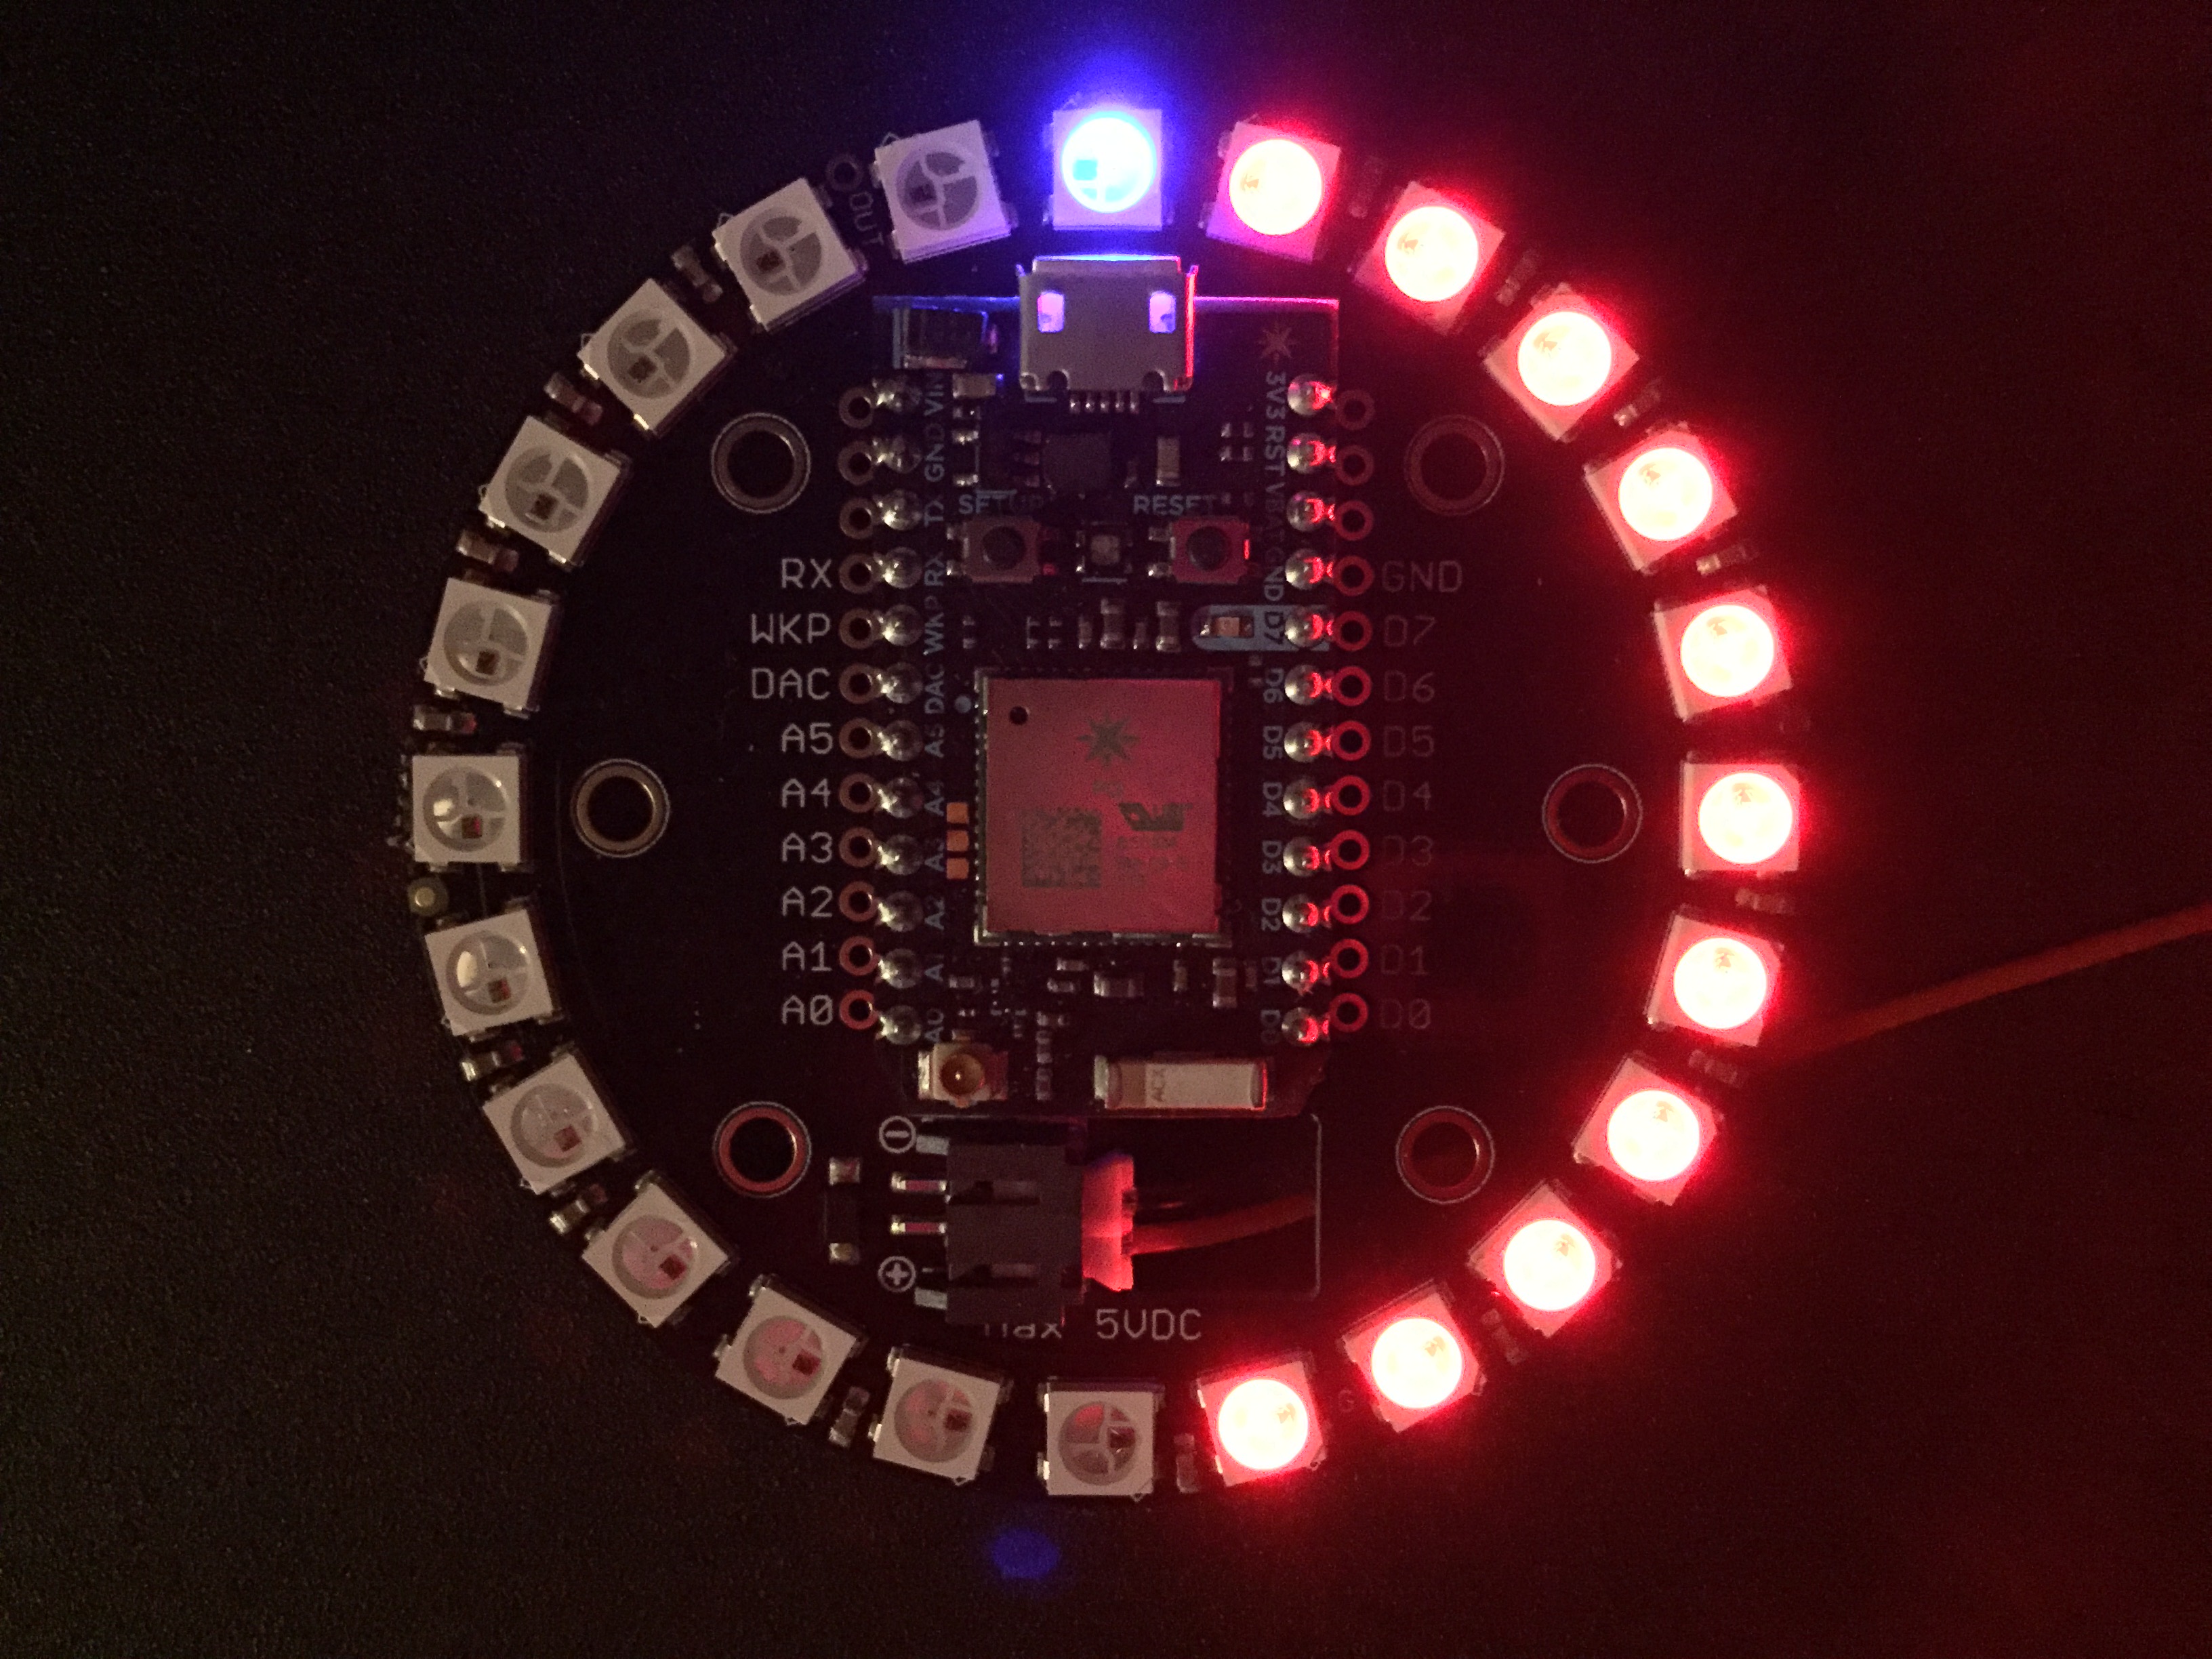
Before going outdoors, it is quite useful to know what the temperature is (especially if you’re living in an apartment) and also know if there is rain or other precipitation on the forecast today. Visualizing temperature is done in this case by letting pixel 0 (at the top – 12 o’clock) be zero degrees. And show positive outdoor temperatures clockwise with red leds, sub-zero temperatures counter-clockwise with blue leds and precipitation by lighting up the pixel 0 with either blue or red, depending on the outdoor temperature. It looks something like this:
Temperature 11°C and no precipitation:
Temperature -4°C and no precipitation:
Temperature 11°C and precipitation:
Source Code
Source code for this project can be found here:
https://github.com/plopp/energy-meter-neopixel