Student work - Interactive Video feedback
The students Henrik Johansson, Steven Ly, Jakob Olsson, Max Winberg and Viktor Yberg at KTH Stockholm has finished their work on an interactive video feedback website.
On this webpage a video of coins dropping synchronized to energy meter data can be viewed. This allow the user to get an engaging visualization of the money spent on energy over a period of time.
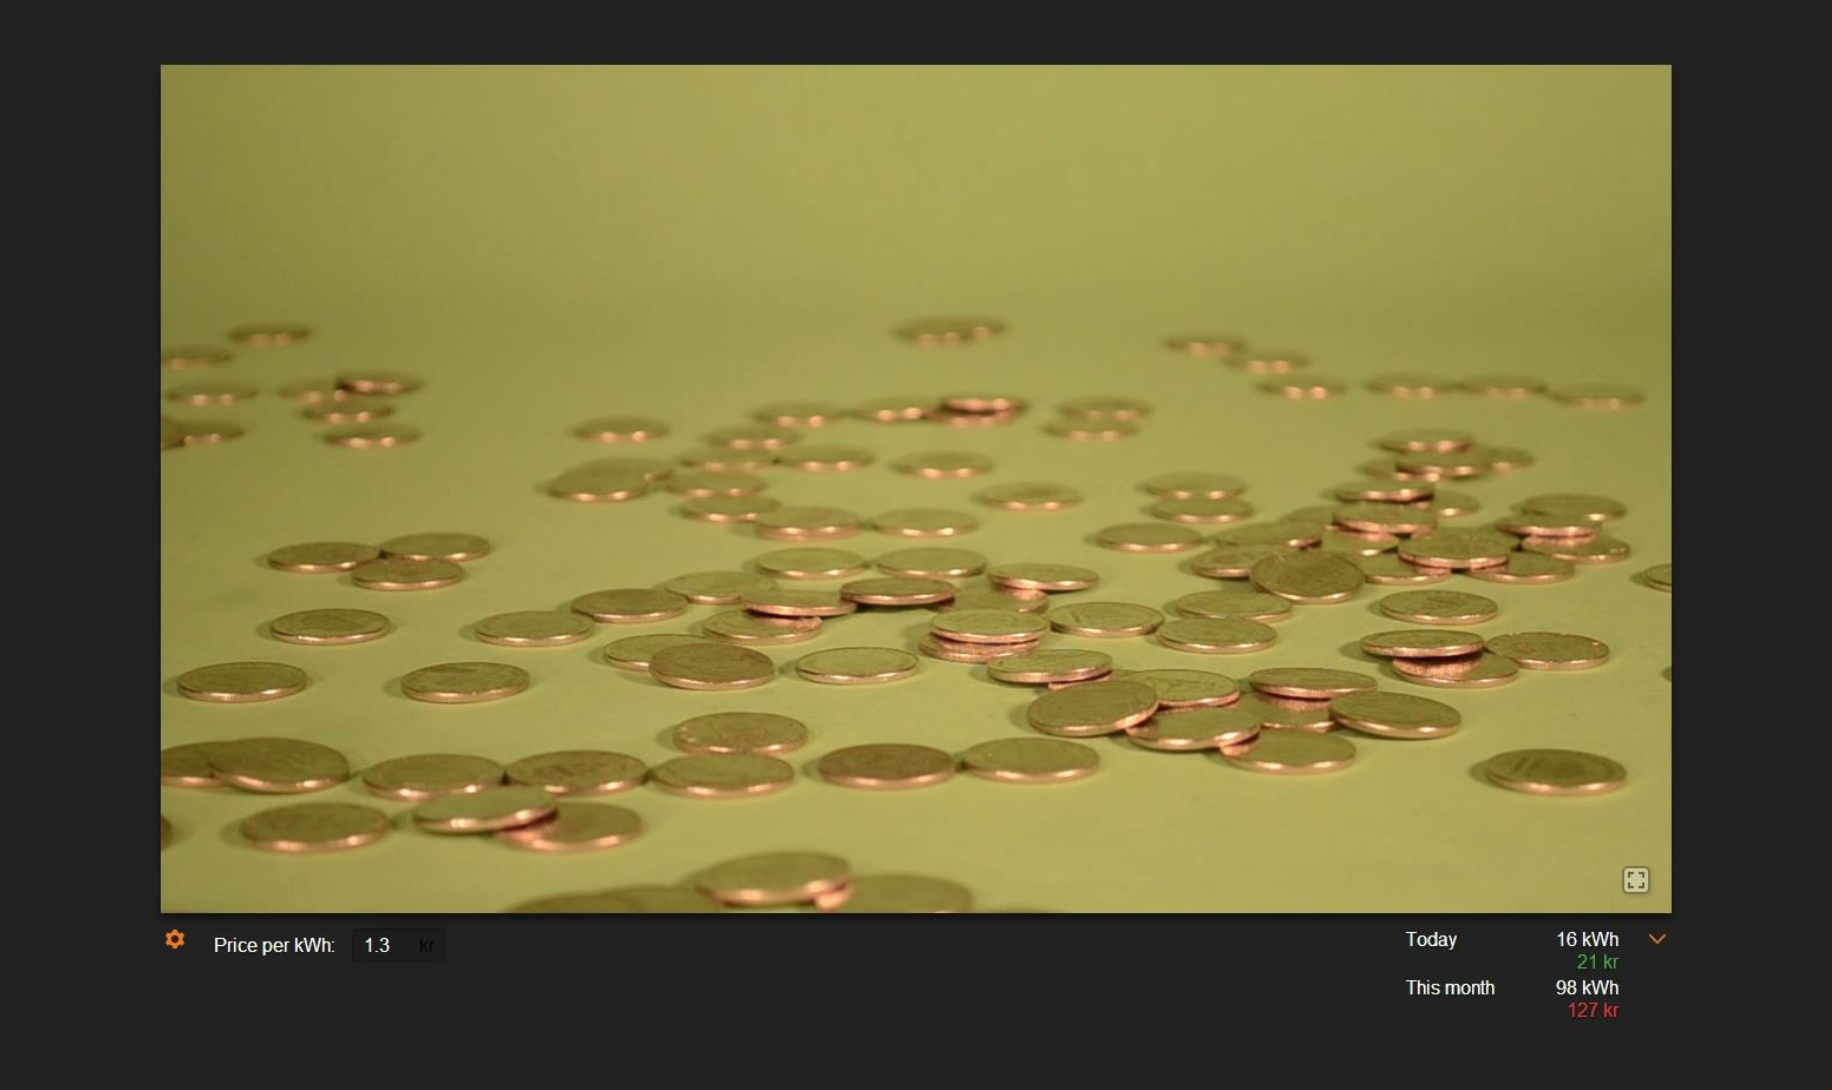
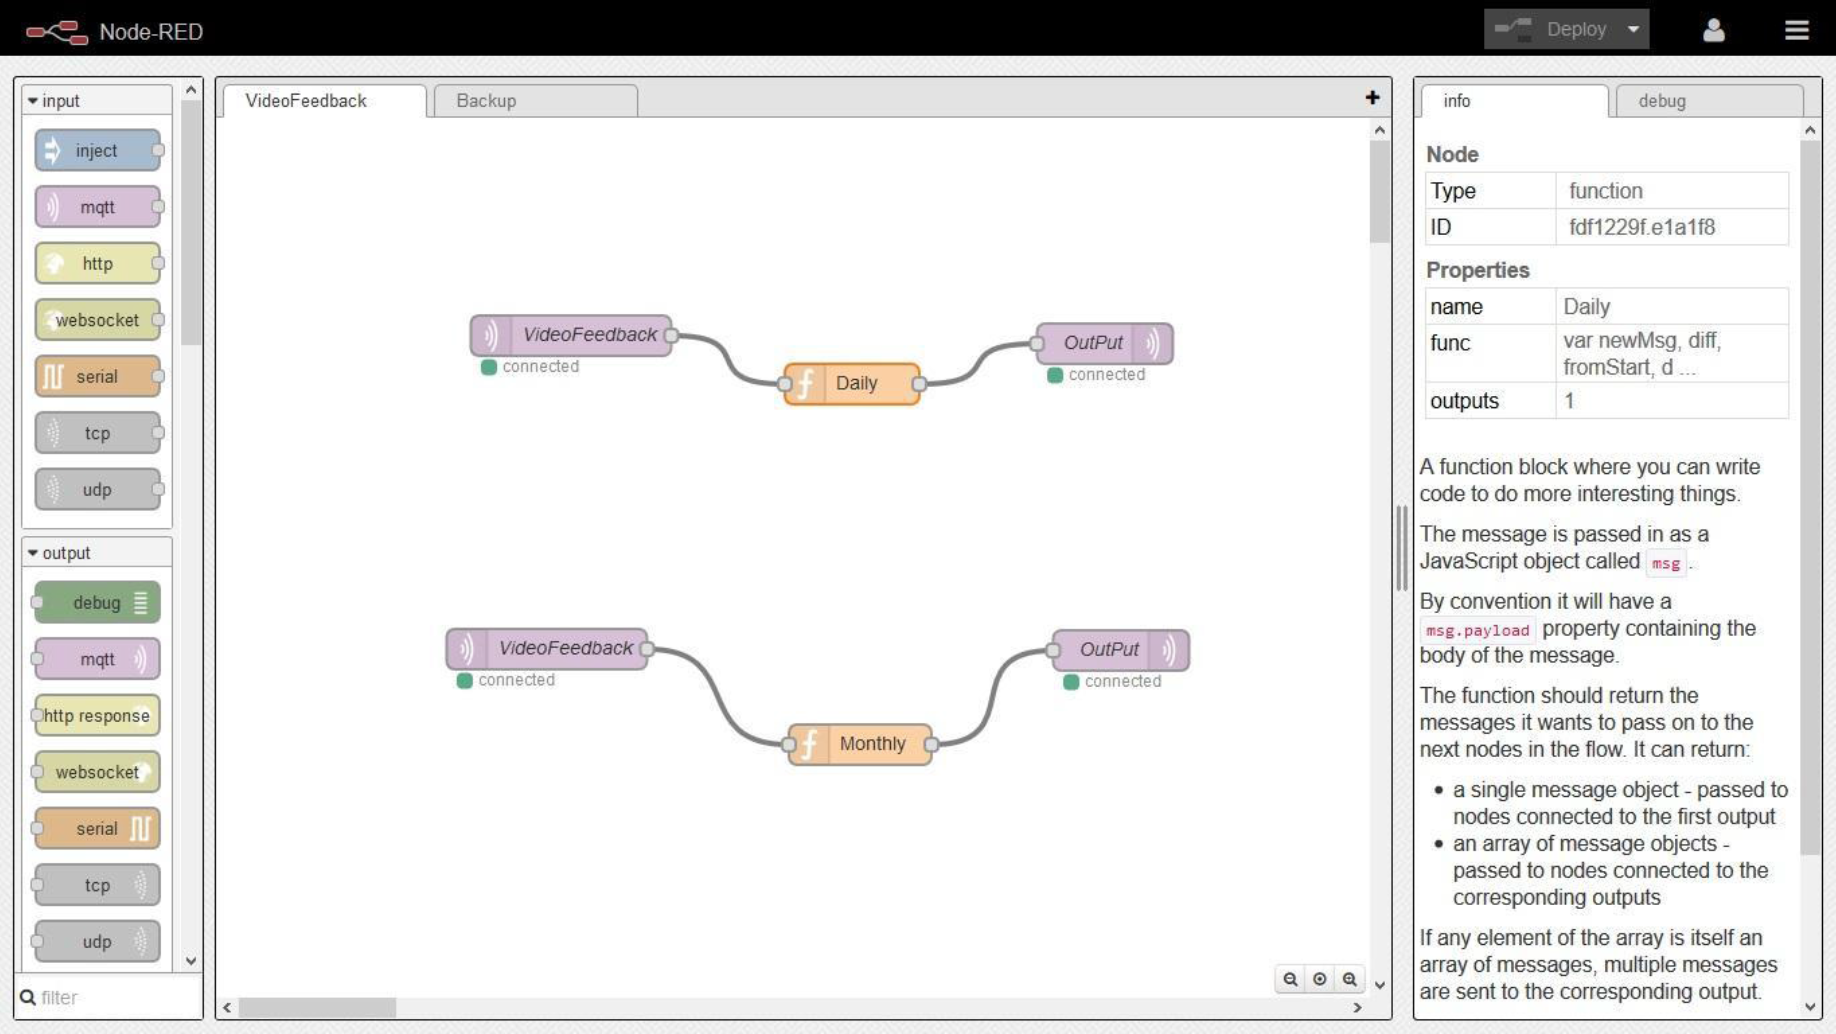
Data in the demo is taken from the Munktell science park demo site. A small script in Node Red created the signal that controls the video. One signal for a monthly summary and one for a daily summary.
The report can be found here:
https://www.dropbox.com/s/7lowhmpmkuhfuky/Videofeedback%20group5.pdf?dl=0
The project description can be found here:
https://www.dropbox.com/s/04sssxxn068qi5i/Video%20Feedback.docx?dl=0
More updates to come.