First Web Visualization
This guide will show you how to set up your first web visualization using the Open Energy Playground.
This includes the following steps:
- Use the graphical programming tool node-RED to fetch the solar power data from a server.
- Configure an animation so that it shows the amount of solar power generated.
Fetch solar power data with node-RED
Node-RED is a tool for wiring together hardware devices, APIs and online services in new and interesting ways. - node-RED
If you have followed the steps in the getting started guide, you should have node-red running on your computer.
(If you are running the playground on linux, replace 192.168.99.100 with localhost everywhere below)
Navigate to node-RED
Open a browser and go to http://192.168.99.100:1880
This is the node-red control panel! Now we are going to add a small “flow” that subscribes to energy updates from an energy meter in a house in Eskilstuna.
To get started quickly we can import a node that is already configured with the name of the meter in Eskilstuna.
Import data node
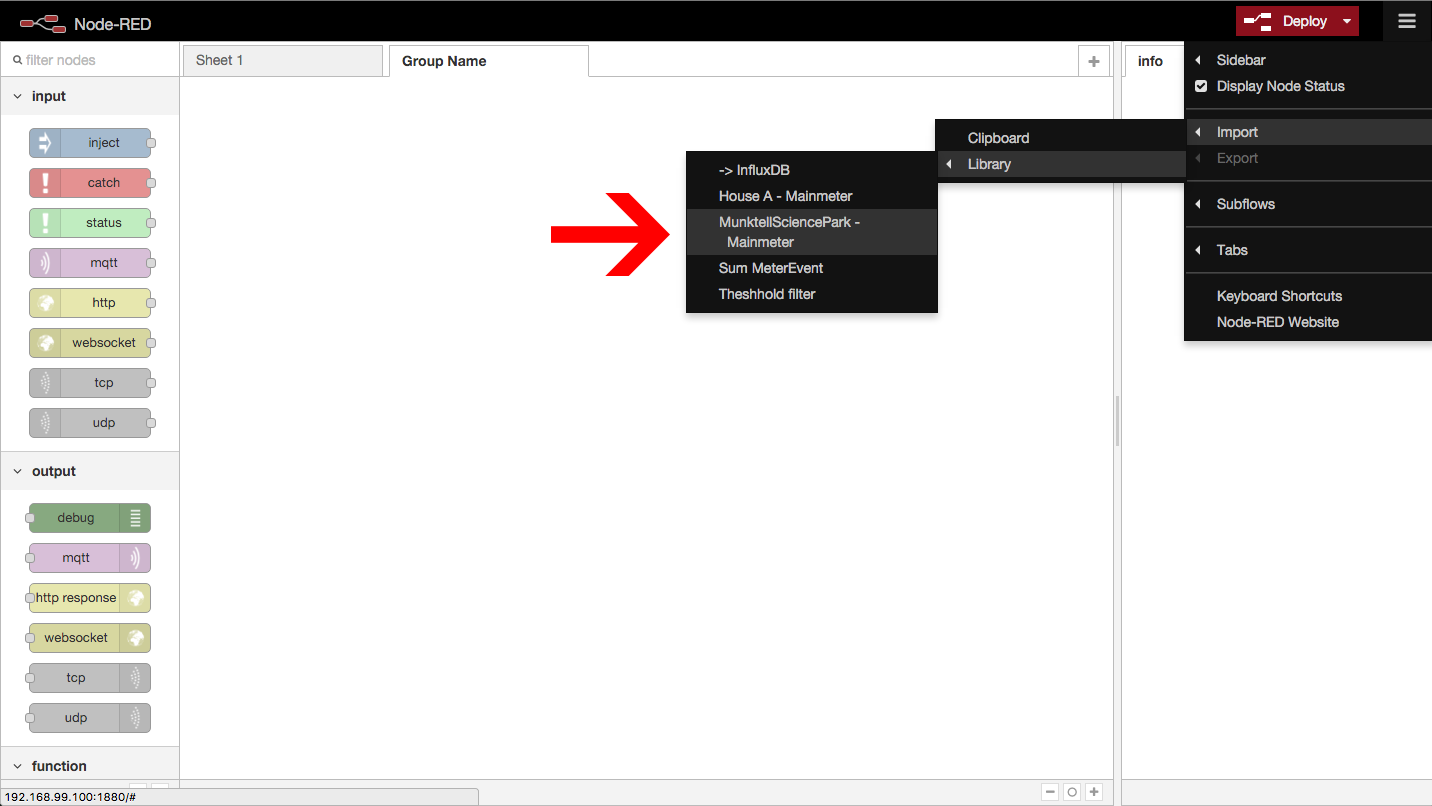
Under the hamburger menu in the upper right corner, navigate to Import > Library > MuntellSciencePark - Mainmeter. This will create an mqtt node that you can place on the sheet, click anywhere in the big white space to place the node.
Connect to debug node
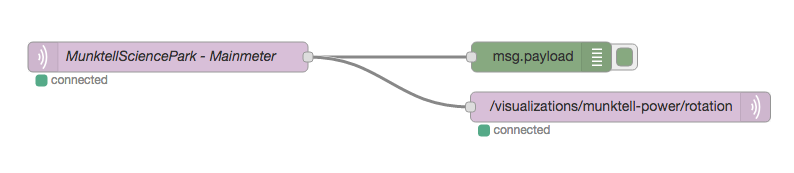
Drag a debug node (from where the arrow points in the image), and place it anywhere on the sheet.
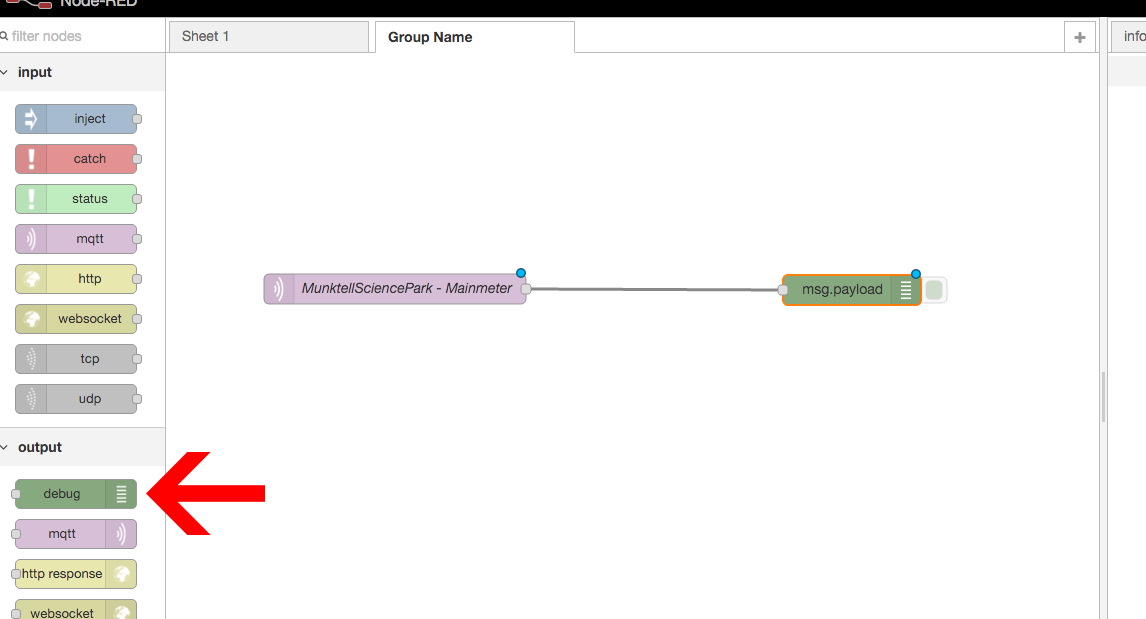
Connect the MunktellSciencePark - Mainmeter node with the debug node (now called msg.payload) by dragging the wire from the right side of the left node, to the left side of the right node. You should end up with something like the image above, where the two nodes are connected together with a wire.
Configure the data node
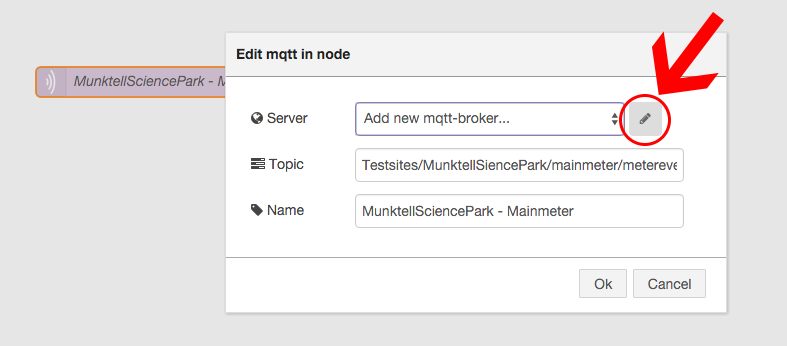
Double click the MunktellSciencePark node. This opens up a dialog where we can edit the settings of the node. The settings are:
- What server will this data come from? (needs configuration)
- What topic on that server are we listening to?
- What is the name of the node?
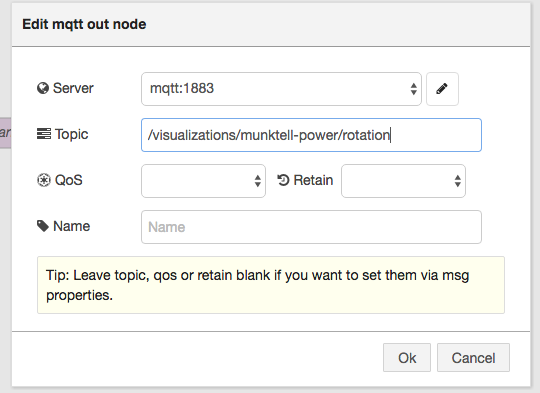
To configure a new MQTT server, press the edit button (the pen) next to the server dropdown, as marked in the image below.
In the server field, enter op-en.se, and leave the rest of the settings as they are.
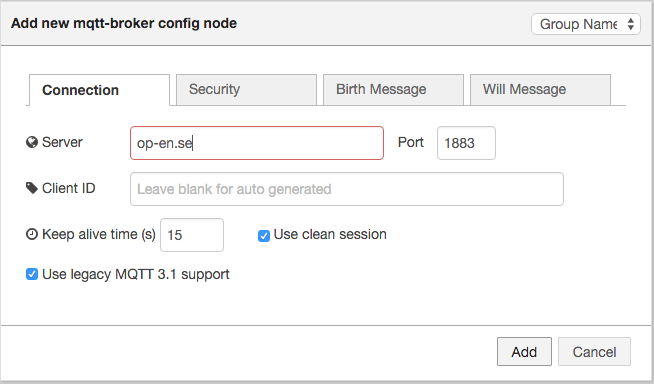
When the dialog looks like the screen above, press “Add”
Press Ok, finishing the edit of the mqtt node.
Deploy the nodes
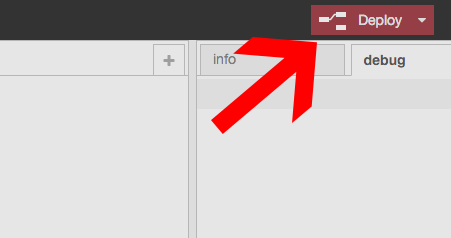
Now we are ready to deploy our new nodes. Press the deploy button in the upper right corner.
View the datastream
You should see a message saying “successfully deployed”. Under the “Debug” tab to the right, data messages should now be pouring in.
We are now watching LIVE how much energy is being spent in the Munktell Science Park in Eskilstuna.
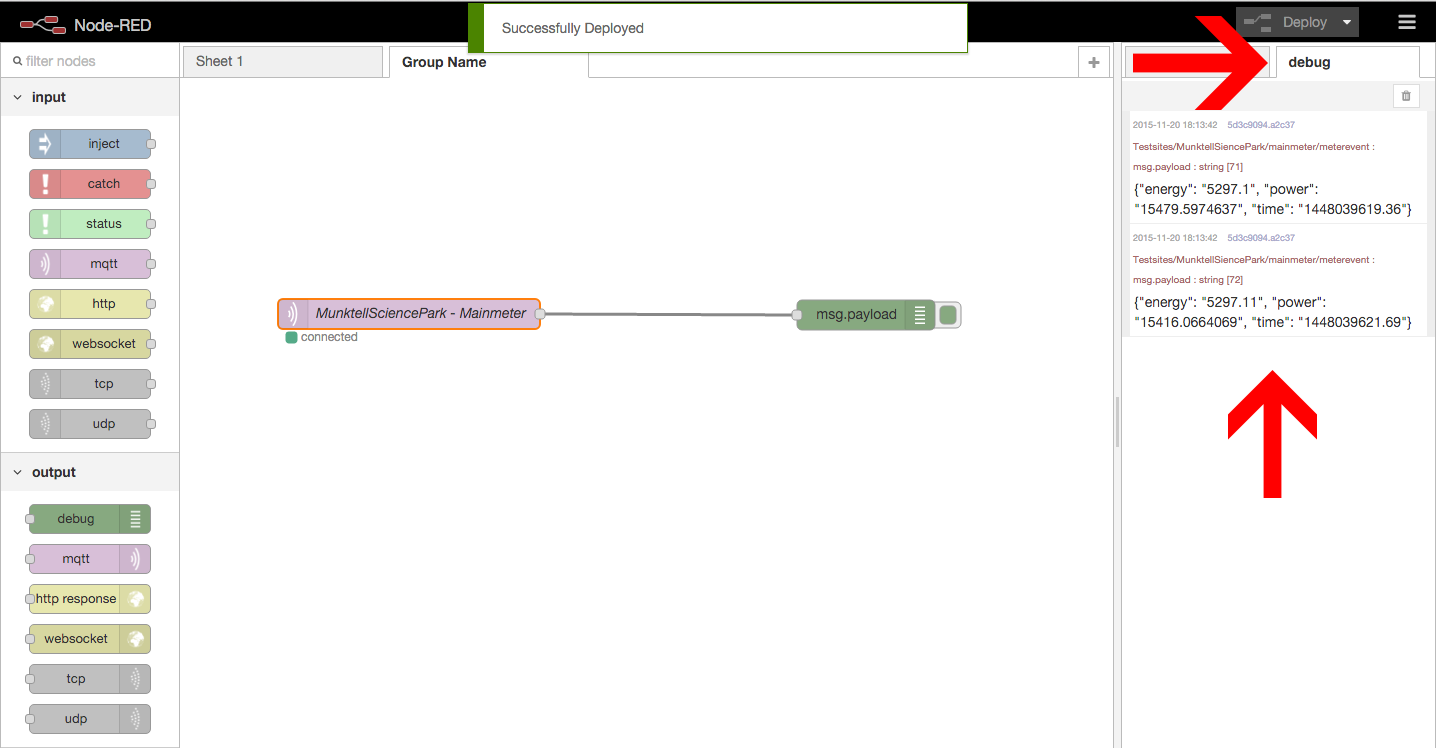
A message might look like this:
{"energy": "5319.7", "power": "25265.9571994", "time": "1448042745.73"}
Energy is the accumulated energy in kWh that the Munktell Science Park has used.
Time is the time of this message, as a Unix Timestamp. This is a common way of representing time in computers. It is defined as the number of seconds that have elapsed since 00:00:00 (UTC), Thursday, 1 January 1970. If we convert this to a normal date, using unixtimestamp.com, we see that it is equivalent to Fri, 20 Nov 2015 18:05:45 (UTC). The time that this tutorial was written :)
Power is the current power of the build in watts (W). At the moment of writing, ~25kW of power was being used.
Now that we have real time data flowing in, we can proceed to part 2.
Animate solar power generation
In the last section, we fetched data from a remote server and viewed it in node-RED. But to use it in an animation, it is best to relay that data to our local playground.
Relaying data to local MQTT broker
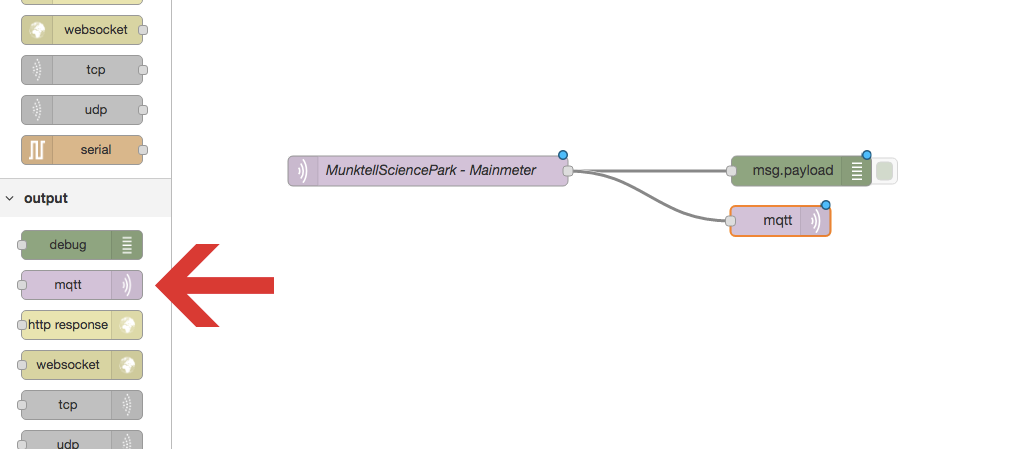
Drag out a new MQTT output node, place it on the sheet, and connect it to the Munktell node.
Like we did before, double click the new node to edit the server settings.
Select the server Add new mqtt-broker... from the dropdown list and press the edit pen.
Type in the server mqtt, leaving all other settings as default.
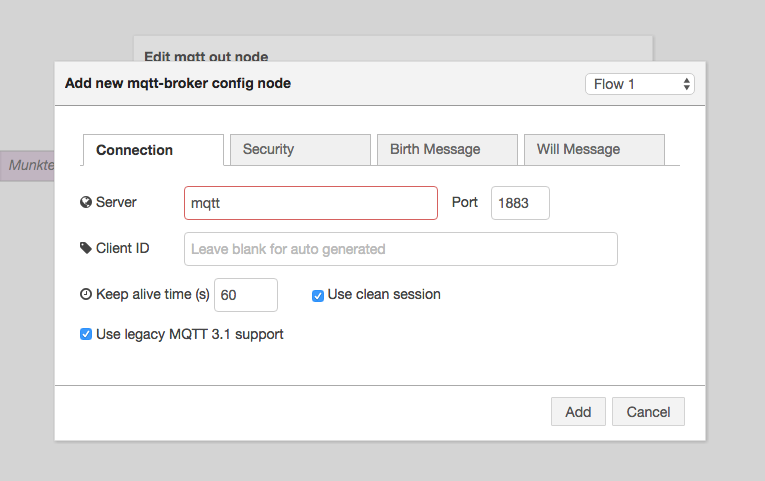
Press Add.
To use it in our visualization, we redirect the message to another topic. Different topics can be thought of as different chat channels. Set the topic field of the MQTT node to /visualizations/munktell-power/rotation. This could be anything, as long as we refer to the same topic later in the visualization.
Press OK, and deploy the changes by again pressing Deploy in the upper right corner.
The new node should be deployed and showing a status of connected.
Viewing a local webpage
We are now ready to view this realtime data in a webpage.
Bundled in the Playground is a simple html file that is an example of how to use the animation framework Animera.js to implement real-time animations.
To view this example, navigate to http://192.168.99.100/first-web-visualization.html
You should see something like this:
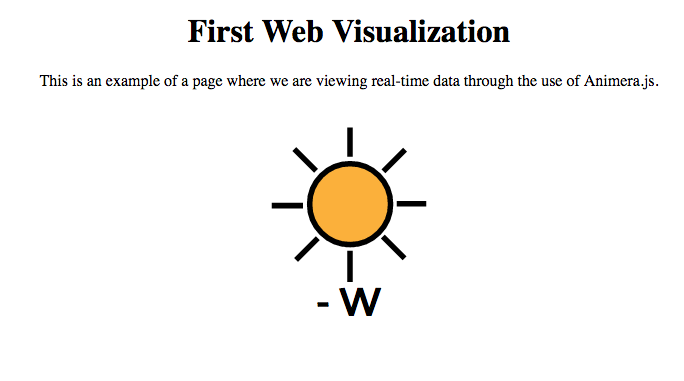
As you can see, the example renders correctly, but the connection to the real-time data is not configured correctly, since the text below the sun is - W.
To make the connection, we need to edit the html file.
Connecting the visualization with real-time data
In the folder of the Open Energy Playground (that you might have downloaded in the getting started guide). Open the file data/www/examples/first-web-visualization/index.html in a text editor.
Row 9 of the file reads:
<object style="width: 200px; height:220px;" data="/animera.js-widgets/sunwidget.html?server=http://192.168.99.100:5000&topic=/visualizations/munktell-power/rotation&subproperty=power&max=60000"></object>
There are four things here that are important to us:
- Topic we have to change to the topic that we configured the mqtt node with earlier.
- Max is a variable related to this specific visualization. We can set the speed of the animation with this, but it's optional.
- Server we don't need to think about right now (it is already configured to the ip-adress of of the docker virtual machine, and the app-server running on port 5000).
- Subproperty we don't have to think about either (it is set to the property power of the JSON object that we are listening to via mqtt)
Change the topic from /topic to /visualizations/munktell-power/rotation and save the file.
Reload the the webpage and we get:
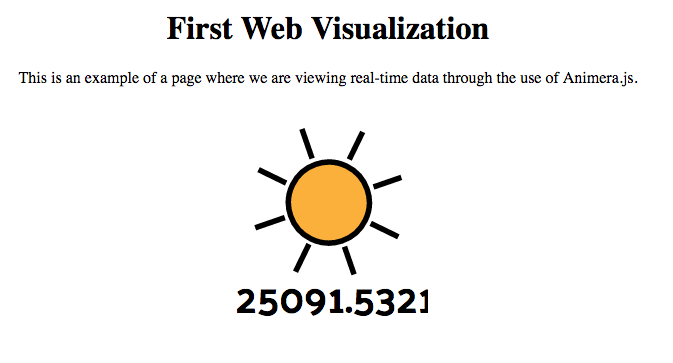
A visualization connected to real time data!