Create your own visualization widget
This tutorial will assist you when creating your own widget to visualize real-time data. These widgets are updated (every second/for every new datapoint) and is perfect when you want to show momentary energy usage (or production!), temperature and effect. If you want to show more in-depth data such as consumption during the last hour/day/week, we suggest that you use a higher resolution visualization, for example Grafana.
If you don't want to create your own widget but only modify one of ours, proceed to step 3.
Start by sketching your visualization on paper or digitally. What parts will be moving and in what way? How will it work technically? If you don’t have any ideas, ask your family, friends or colleagues what energy is to them? What would they describe it like? How do they visualize it? By doing so, you will sketch something that not only aligns with your idea but also something that is grounded in other people’s minds. Next step is to draw something in Illustrator, Sketch or Inkscape that can be exported to an SVG file.
After exporting the widget, the .svg file can be opened in your regular text editor (for example Atom). The code will look something like this:
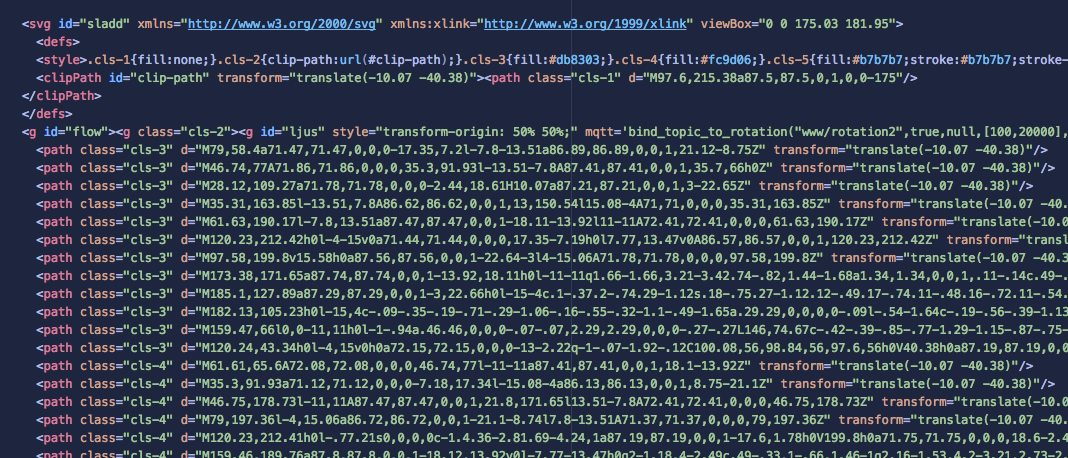
Clone the animera.js repository from Github. Duplicate the html file which is most similar to the animation of your widget (rotation, flow etc) and exchange the svg-part with your widget’s svg code. However, check first that attributes applied to the svg in the original code is transferred to your code. In the case with the cogwheel rotation attribute to the flowing cord, the style and mqtt attributes needs to be transferred in order for the widget to rotate properly.

Run gulp in the repo folder, open a browser window (we suggest Chrome) and go to http://localhost:8080/dist/widgets/widget-loop.html?topic=test/signalB. The widget-loop part can be changed depending on which widget you want to use, see names of the widgets below. The animation widget will show along with watts from one of our randomized mqtt output (topic=test/signalB).
If you want to adjust the flow of the widget (perhaps you want it to look like water flowing, or temperature ranging from red to blue using a gradient) this can be done by adding or modifying parameters in the URL.
If you want a closer look at the parameters and which are available to customize, they are listed under the AnimeraWidget.init-function in the html code.
Nice, you now have a widget visualizing live energy data!
Next step is to connect the widget to the correct datasource, and also publish the html file online.
Once you have an internet link you can for example make a QR-code out of the widget (Go to http://goqr.me paste the link to the widget and download the QR-code) to make it accessible for others or embed the widget